Chapterبەش 2 · Lectureوانە 2.5
Grouping Data: Frequency Tablesپۆلێنکردنی دراوە: خشتەکانی دووبارەبوونەوە
Turn a long list of numbers into a frequency table: range, number of classes (Sturges and Yule), class width rounded up, class limits and boundaries, class marks, tally counting, relative and cumulative frequency — on the course's 60-value example and the 100-value homework, where decimal data need continuous classes.
لیستێکی درێژی ژمارە بکە بە : ، ژمارەی ( و )، کە بەرەو سەرەوە نزیک دەکرێتەوە، و ، ، ژماردن بە ، و — لەسەر نموونە 60 نرخییەکەی کۆرسەکە و ڕاهێنانە 100 نرخییەکە، کە تێیدا دەیی پێویستی بە بەردەوام هەیە.
What you will learnچی فێر دەبیت
- Explain the difference between ungrouped and grouped data.
- Find the range, the number of classes and the class width (rounded up).
- Build classes without gaps or overlaps, for whole-number and for decimal data.
- Count frequencies with tally marks and check that they add up to n.
- Add class marks, boundaries, relative and cumulative frequencies to the table.
- جیاوازیی نێوان و ڕوون بکەیتەوە.
- ، ژمارەی و (بەرەو سەرەوە) بدۆزیتەوە.
- بێ بۆشایی و بێ تێکەڵبوون بۆ و بۆ ژمارەی دەیی دروست بکەیت.
- بە بژمێریت و بپشکنیت کە دەکەنە n.
- ، ، و بخەیتە سەر خشتەکە.
From a long list to a short tableلە لیستێکی درێژەوە بۆ خشتەیەکی کورت
Here are the first 15 of 60 numbers that the course calls Example 1: 142, 76, 80, 120, 132, 82, 96, 126, 157, 60, 164, 88, 90, 98, 101, … Looking at a list like this, you cannot see much: Is 120 a typical value? Are there many small values? Each number is one observation of a variable. To see the pattern, we put the observations into groups and count how many fall into each group.
ئەمە یەکەم 15 ژمارەیە لە 60 ژمارە کە کۆرسەکە پێی دەڵێت نموونەی 1: 142، 76، 80، 120، 132، 82، 96، 126، 157، 60، 164، 88، 90، 98، 101، … بە سەیرکردنی لیستێکی لەم شێوەیە زۆر شت نابینیت: ئایا 120 نرخێکی ئاساییە؟ ئایا نرخی بچووک زۆرن؟ هەر ژمارەیەک یەک لە گۆڕاوێک. بۆ بینینی شێوەکە، دەخەینە نێو گرووپەوە و دەژمێرین چەندیان دەکەوێتە هەر گرووپێکەوە.
Data as it was collected: a plain list of values not yet arranged into .
دراوە وەک کۆکراوەتەوە: لیستێکی سادەی نرخەکان کە هێشتا نەخراونەتە نێو .
Data arranged into with a for each class, as in a .
دراوەیە کە خراوەتە نێو و بۆ هەر کلاسێک هەیە، وەک لە .
So data come in two forms: ungrouped (the original list, as collected) and grouped (arranged in a frequency table). This lesson turns the first into the second.
کەواتە بە دوو شێوە دێت: (لیستە ڕەسەنەکە وەک کۆکراوەتەوە) و (ڕیزکراو لە ). ئەم وانەیە یەکەمیان دەکاتە دووەم.
From a long list to a short tableلە لیستێکی درێژەوە بۆ خشتەیەکی کورت
Like sorting lettersوەک ڕیزکردنی نامە
A post office in Erbil does not keep letters in one big heap. It sorts them into pigeonholes, one for each district, and then counts each pigeonhole. A frequency table does the same with numbers: each class is a pigeonhole for an interval of values, and the frequency is how many values landed in it.
پۆستەخانەیەک لە هەولێر نامەکان لە یەک کۆگای گەورەدا ناهێڵێتەوە. ڕیزیان دەکات بۆ ناو چەند کونجێک، هەر کونجێک بۆ گەڕەکێک، پاشان هەر کونجێک دەژمێرێت. هەمان کار بە ژمارە دەکات: هەر کونجێکە بۆ نرخ و ئەوەیە چەند نرخ کەوتووەتە ناوییەوە.
Where the analogy stops workingسنووری ئەم نموونەیە
Every letter has exactly one district. Number classes must be built the same way: no gaps and no overlaps, so that every value has exactly one class. That is the hard part of this lesson.
هەر نامەیەک تەنها یەک گەڕەکی هەیە. ژمارەش دەبێت بە هەمان شێوە دروست بکرێن: بێ بۆشایی و بێ تێکەڵبوون، بۆ ئەوەی هەر نرخێک تەنها یەک هەبێت. ئەمە بەشە قورسەکەی ئەم وانەیەیە.
The parts of a frequency tableبەشەکانی خشتەیەکی دووبارەبوونەوە
A table that lists the values or of a with the of each. It shows how the data is distributed.
خشتەیەکە کە نرخەکان یان لەگەڵ هەر یەکێکیان ڕیز دەکات. پیشانی دەدات دراوەکە چۆن دابەش بووە.
- Class: one of the groups. Every class covers an interval of values, for example 60–74.
- Class frequency f: how many observations fall into the class.
- Class limits: the smallest value of a class is its lower class limit (LL); the largest is its upper class limit (UL).
- Class mark (midpoint): the middle of the class. It stands for all the values of the class when we calculate with grouped data (see the mean of grouped data).
- : یەکێک لە گرووپەکان. هەر نرخ دەگرێتەوە، بۆ نموونە 60–74.
- f: چەند دەکەونە ناو .
- : بچووکترین نرخی سنووری خوارەوەیەتی (LL)؛ گەورەترینیان سنووری سەرەوەیەتی (UL).
- : ناوەڕاستی . کاتێک بە ژماردن دەکەین، جێگەی هەموو نرخەکانی دەگرێتەوە (سەیری ناوەندی دراوەی پۆلێنکراو بکە).
For the class 60–74: .
بۆ 60–74: .
Steps 1 and 2: the range and the number of classesهەنگاوەکانی 1 و 2: مەودا و ژمارەی کلاسەکان
Step 1, the total range: how far the data spread from end to end.
هەنگاوی 1، گشتی: لە سەرێکەوە بۆ سەرەکەی تر چەند بڵاوە.
The largest value minus the smallest value. It is the simplest measure of , but it uses only two values.
گەورەترین نرخ لە بچووکترین نرخ کەم دەکرێتەوە. سادەترین پێوەری ، بەڵام تەنها دوو نرخ بەکار دەهێنێت.
Step 2: choose the number of classes m. Too few classes hide the shape; too many leave most classes nearly empty. The course gives two formulas, where n is the number of observations:
هەنگاوی 2: ژمارەی m هەڵبژێرە. زۆر کەم شێوەکە دەشارێتەوە؛ زۆر زۆر زۆربەی نزیکەی بەتاڵ دەهێڵێتەوە. کۆرسەکە دوو هاوکێشە دەدات، کە n ژمارەی :
Both grow slowly. The number 3.322 is , so Sturges' rule is the same as : each time the data double, you get just one more class.
هەردووکیان هێواش گەورە دەبن. ژمارەی 3.322 دەکاتە ، بۆیە هەمان ـە: هەر جارێک دوو هێندە ببێت، تەنها یەک زیاتر بەدەست دێت.
| n | Sturges | Yule | m |
|---|---|---|---|
| 20 | 5.3220 | 5.2869 | 5 |
| 60 | 6.9070 | 6.9579 | 7 |
| 100 | 7.6440 | 7.9057 | 8 |
| 1000 | 10.9660 | 14.0585 | 11–14 |
Step 3: the class width — always round upهەنگاوی 3: پانیی کلاس — هەمیشە بەرەو سەرەوە
The size of each : the divided by the number of classes, always rounded up.
قەبارەی هەر : دابەش بە ژمارەی کلاسەکان، هەمیشە بەرەو سەرەوە نزیک دەکرێتەوە.
The width L (the notes call it the length of a class) shares the whole range between the m classes.
پانیی L (تێبینییەکان پێی دەڵێن درێژیی ) هەموو بەسەر m دابەش دەکات.
L is usually not a whole number, and here the rounding rule is special: always round L up. The m classes must reach from the smallest to the largest value. If is rounded down, is shorter than the range and the largest values have no class. Example 1: → 15, and , so the classes reach far enough. With the seventh class would end at , and 164 would have no class.
L زۆرجار نییە و لێرەدا یاسای تایبەتە: هەمیشە L بەرەو سەرەوە نزیک بکەرەوە. m دەبێت لە بچووکترین نرخەوە بگەنە گەورەترینیان. ئەگەر بەرەو خوار نزیک بکرێتەوە، لە کورتتر دەبێت و گەورەترین نرخەکان نابێت. نموونەی 1: ← 15 و ، بۆیە تا دوورێکی پێویست دەگەن. بە حەوتەم لە کۆتایی دەهات و 164 هیچ نەدەبوو.
Example 1: 60 values in 7 classesنموونەی 1: 60 نرخ لە 7 کلاسدا
The task in the notes: change these ungrouped data into grouped data with a frequency table.
ئەرکەکە لە تێبینییەکاندا: ئەم بکە بە بە .
142, 76, 80, 120, 132, 82, 96, 126, 157, 60, 164, 88, 90, 98, 101, 103, 104, 109, 114, 126, 122, 111, 116, 130, 142, 120, 113, 121, 119, 125, 126, 156, 136, 150, 154, 122, 123, 139, 125, 111, 65, 68, 72, 150, 116, 119, 116, 120, 78, 93, 95, 98, 131, 136, 118, 126, 156, 136, 137, 110.
142، 76، 80، 120، 132، 82، 96، 126، 157، 60، 164، 88، 90، 98، 101، 103، 104، 109، 114، 126، 122، 111، 116، 130، 142، 120، 113، 121، 119، 125، 126، 156، 136، 150، 154، 122، 123، 139، 125، 111، 65، 68، 72، 150، 116، 119، 116، 120، 78، 93، 95، 98، 131، 136، 118، 126، 156، 136، 137، 110.
- Rangeمەودا
.
.
- Number of classesژمارەی کلاسەکان
Yule: . (Sturges gives too.)
: . ( دەدات.)
- Widthپانی
, rounded up to 15.
، بەرەو سەرەوە دەبێتە 15.
- Classesکلاسەکان
Start at the smallest value, 60. The data are whole numbers, so : . The class 60–74 holds exactly 15 whole numbers (60, 61, …, 74), and the next class starts at 75.
لە بچووکترین نرخەوە دەست پێبکە، 60. ، بۆیە : . 60–74 ڕێک 15 لە خۆ دەگرێت (60، 61، …، 74) و دواتر لە 75 دەست پێدەکات.
Example 1: 60 values in 7 classesنموونەی 1: 60 نرخ لە 7 کلاسدا
Counting with tally marksژماردن بە نیشانەکانی ژماردن
Now go through the 60 values once. For each value, draw a short stroke in its class. Every fifth stroke crosses the four before it, so the strokes can be counted in fives. At the end, count the strokes: they become the frequencies.
ئێستا یەک جار بە ناو 60 نرخەکەدا بڕۆ. بۆ هەر نرخێک هێڵێکی کورت لە بکێشە. هەر پێنجەمین هێڵ چوار هێڵەکەی پێشووی دەبڕێت، بۆیە دەتوانیت هێڵەکان پێنج پێنج بژمێریت. لە کۆتاییدا هێڵەکان بژمێرە: دەبنە .
A short stroke drawn for each value while counting; every fifth stroke crosses the four before it, so you count in fives.
هێڵێکی کورتە کە لە کاتی ژماردندا بۆ هەر نرخێک دەکێشرێت؛ هەر پێنجەمین هێڵ چوار هێڵەکەی پێشووی دەبڕێت، بۆیە بە پێنج پێنج دەژمێریت.
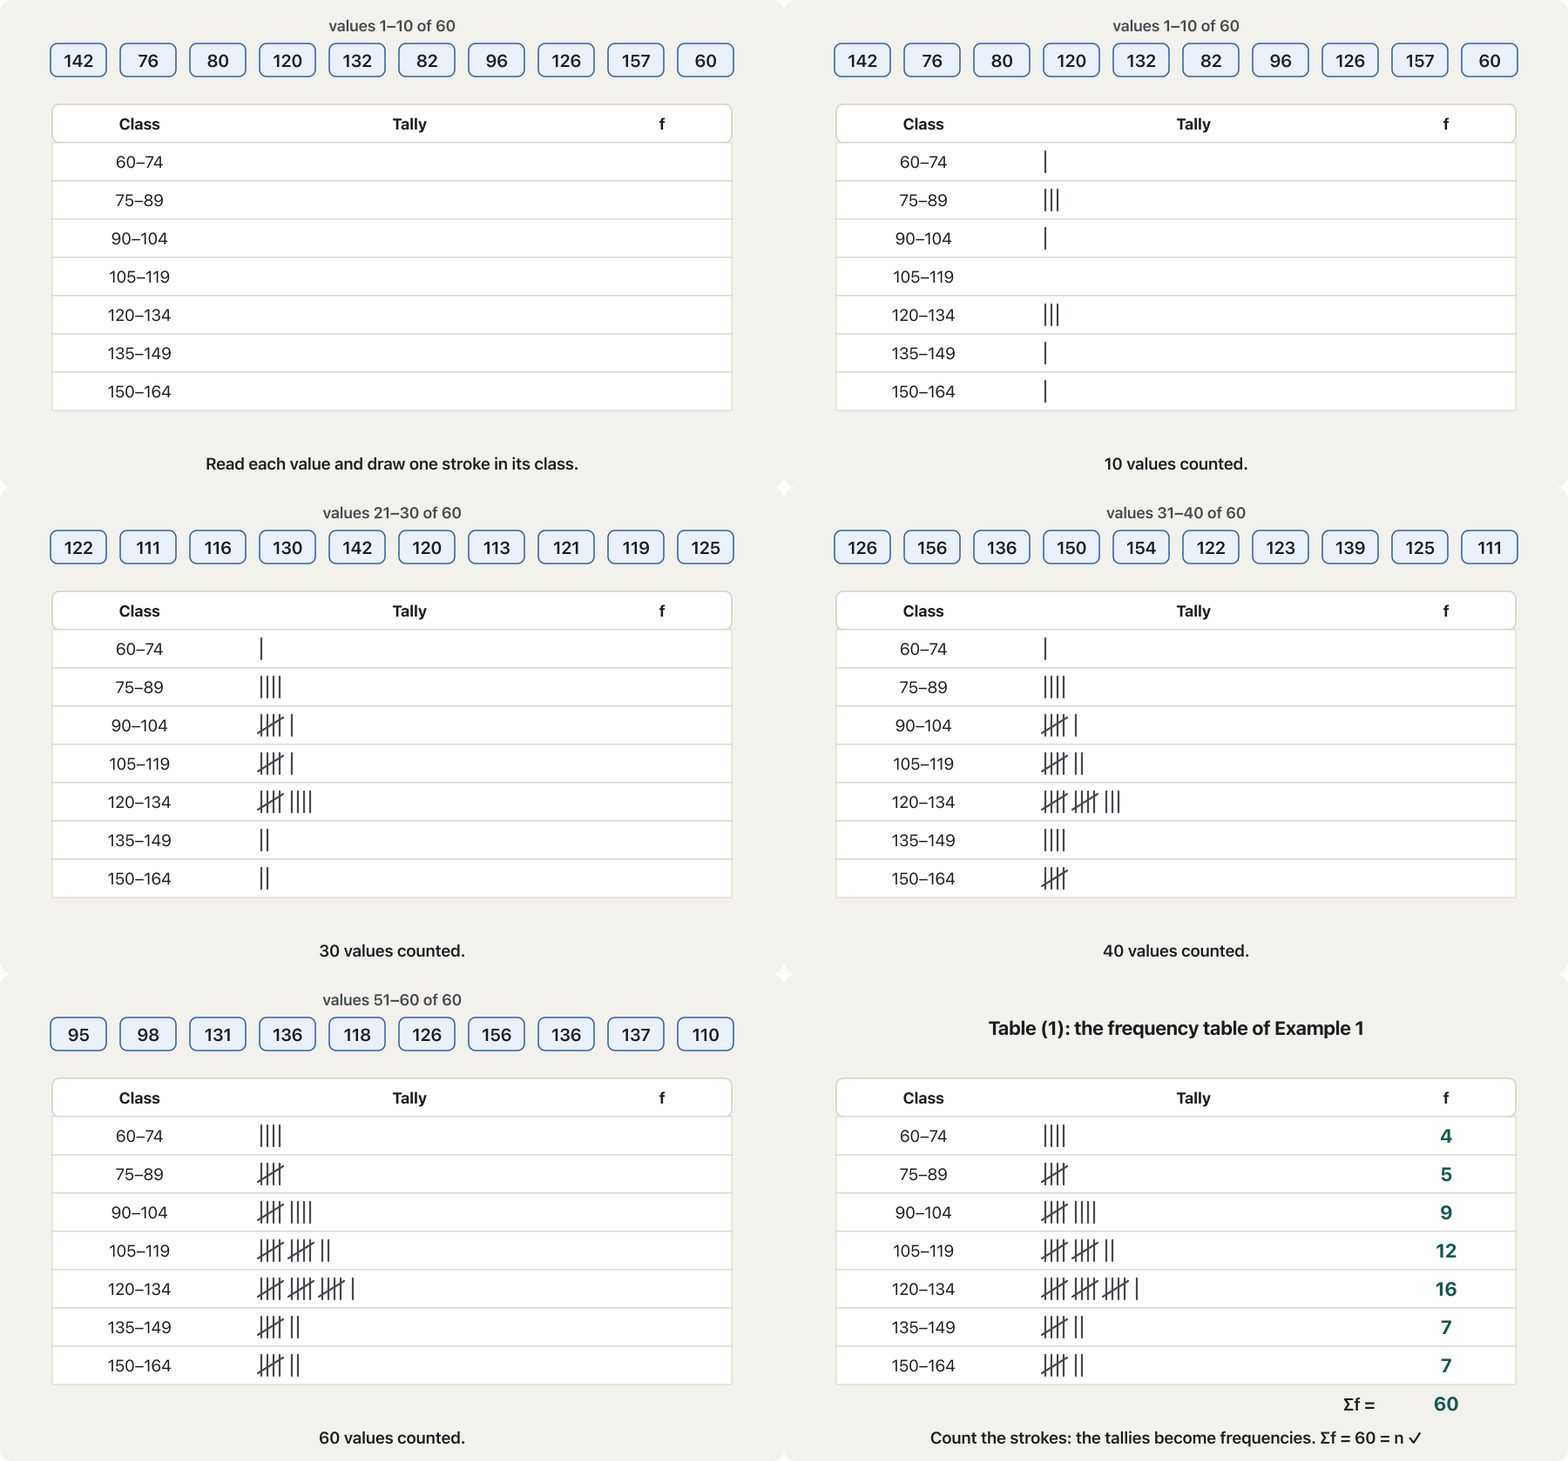
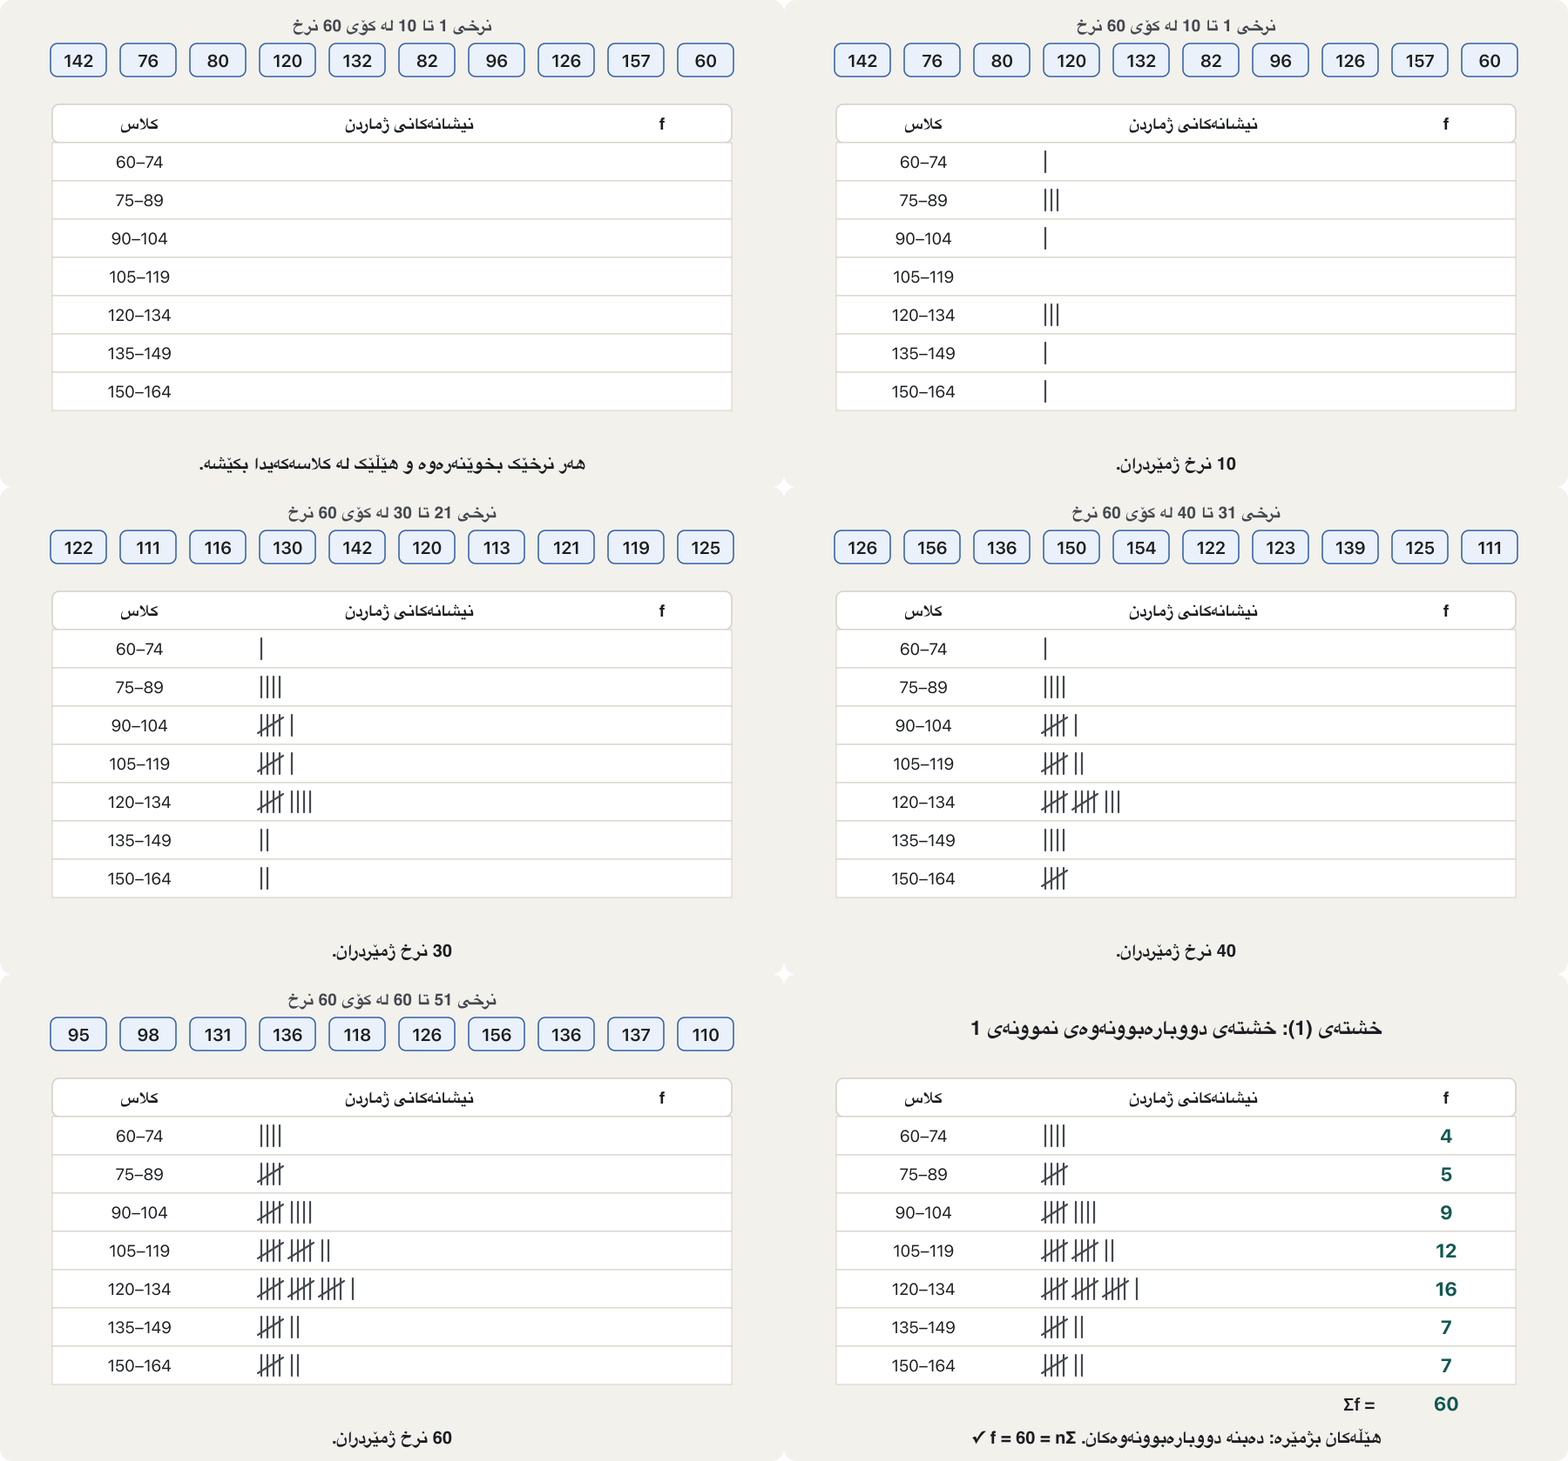
| Class | Frequency f f | Class mark |
|---|---|---|
| 60–74 | 4 | 67 |
| 75–89 | 5 | 82 |
| 90–104 | 9 | 97 |
| 105–119 | 12 | 112 |
| 120–134 | 16 | 127 |
| 135–149 | 7 | 142 |
| 150–164 | 7 | 157 |
| Totalکۆ | 60 |
Always check the total: the frequencies must add up to n. Here , so no value was lost or counted twice.
هەمیشە کۆکە بپشکنە: دەبێت بکەنە n. لێرەدا ، کەواتە هیچ نرخێک ون نەبووە یان دوو جار نەژمێردراوە.
Example 1: 60 values in 7 classesنموونەی 1: 60 نرخ لە 7 کلاسدا
Counting with Pythonژماردن بە Python
A computer does the tally in a loop. Because the classes start at 60 and are 15 wide, (x - 60) // 15 gives the class number of a value x directly: 0 for 60–74, 1 for 75–89, and so on.
کۆمپیوتەر ژماردنەکە بە دەکات. چونکە لە 60 دەست پێدەکەن و پانییان 15ـە، (x - 60) // 15 ڕاستەوخۆ ژمارەی نرخی x دەدات: 0 بۆ 60–74، 1 بۆ 75–89 و بەم شێوەیە.
data = [142, 76, 80, 120, 132, 82, 96, 126, 157, 60, 164, 88, 90, 98, 101,
        103, 104, 109, 114, 126, 122, 111, 116, 130, 142, 120, 113, 121, 119, 125,
        126, 156, 136, 150, 154, 122, 123, 139, 125, 111, 65, 68, 72, 150, 116,
        119, 116, 120, 78, 93, 95, 98, 131, 136, 118, 126, 156, 136, 137, 110]

lowest, width, m = 60, 15, 7
freq = [0] * m
for x in data:
    k = (x - lowest) // width      # class number 0, 1, ..., 6
    freq[k] += 1

n = len(data)
for k in range(m):
    lower = lowest + k * width
    upper = lower + width - 1
    print(f"{lower}-{upper}   f = {freq[k]:2}   f/n = {freq[k] / n:.4f}")
print("total:", sum(freq), "n =", n)60-74 f = 4 f/n = 0.0667 75-89 f = 5 f/n = 0.0833 90-104 f = 9 f/n = 0.1500 105-119 f = 12 f/n = 0.2000 120-134 f = 16 f/n = 0.2667 135-149 f = 7 f/n = 0.1167 150-164 f = 7 f/n = 0.1167 total: 60 n = 60
Explain the codeڕوونکردنەوەی کۆدەکە
- Lineدێڕی 6-7
Start with seven zero counters, one for each class.
بە حەوت سفر دەست پێبکە، یەکێک بۆ هەر .
- Lineدێڕی 8-10
Integer division
//finds the class; the counter of that class goes up by one — a tally mark.دابەشکردنی تەواو
//دەدۆزێتەوە؛ ئەو یەکێک زیاد دەکات — .- Lineدێڕی 16
:.4fprints 4 decimal places, the course's rule.:.4fچوار چاپ دەکات، یاسای کۆرسەکە.
Class boundaries: closing the gapsسنوورە ڕاستەقینەکانی کلاس: داخستنی بۆشاییەکان
The class 60–74 ends at 74 and the next one starts at 75. On the number line there is a gap between them. For whole numbers nothing falls into it, but a graph (next lesson) needs classes that touch, and real measurements such as 74.6 would have no home. So each class gets boundaries halfway between neighbouring limits: .
60–74 لە 74 کۆتایی دێت و دواتر لە 75 دەست پێدەکات. لەسەر بۆشاییەک لە نێوانیاندا هەیە. بۆ هیچ شتێک ناکەوێتە ناوییەوە، بەڵام هێڵکارییەک (وانەی داهاتوو) پێویستی بە پێکەوەلکاو هەیە و پێوانەی ڕاستەقینەی وەک 74.6 هیچ شوێنێکی نابوو. بۆیە هەر وەردەگرێت لە نیوەی نێوان سنوورە دراوسێکاندا: .
The point halfway between the upper limit of one class and the lower limit of the next, so the classes touch without gaps.
ئەو خاڵەیە کە ڕێک لە نێوەڕاستی سنووری سەرەوەی کلاسێک و سنووری خوارەوەی کلاسی دواتردایە، بۆیە کلاسەکان بێ بۆشایی بەیەکەوە دەلکێن.
is the unit of the data: 1 for whole numbers (so ), 0.1 for one decimal place (so ). A boundary always has one more decimal place than the data, so no value can fall exactly on it.
یەکەی : 1 بۆ (کەواتە )، 0.1 بۆ یەک (کەواتە ). هەمیشە یەک زیاتر لە هەیە، بۆیە هیچ نرخێک ناتوانێت ڕێک بکەوێتە سەری.
| Class | Boundaries | Widthپانی | Class mark |
|---|---|---|---|
| 60–74 | 59.5–74.5 | 15 | 67 |
| 75–89 | 74.5–89.5 | 15 | 82 |
| 90–104 | 89.5–104.5 | 15 | 97 |
| 105–119 | 104.5–119.5 | 15 | 112 |
| 120–134 | 119.5–134.5 | 15 | 127 |
| 135–149 | 134.5–149.5 | 15 | 142 |
| 150–164 | 149.5–164.5 | 15 | 157 |
Two useful facts: the width is upper boundary − lower boundary: (not ), and the class mark is the same from the limits or from the boundaries: .
دوو ڕاستیی بەسوود: پانییەکە جیاوازیی نێوان هەردوو : (نەک ) و لە یان لە یەک شتە: .
Relative frequencyدووبارەبوونەوەی ڕێژەیی
A class divided by the total number of values: , or as a .
کلاسێکە دابەش بە کۆی ژمارەی نرخەکان: ، یان وەک .
A relative frequency is a share of the whole, from 0 to 1. Multiplied by 100 it is a percentage. All the relative frequencies add up to 1 (100%).
بەشێکە لە گشت، لە 0 تا 1. کە لە 100 لێک بدرێت دەبێتە . کۆی هەموو دەکاتە 1 (100%).
| Class | f | f/n | % |
|---|---|---|---|
| 60–74 | 4 | 0.0667 | 6.67 |
| 75–89 | 5 | 0.0833 | 8.33 |
| 90–104 | 9 | 0.1500 | 15.00 |
| 105–119 | 12 | 0.2000 | 20.00 |
| 120–134 | 16 | 0.2667 | 26.67 |
| 135–149 | 7 | 0.1167 | 11.67 |
| 150–164 | 7 | 0.1167 | 11.67 |
| Totalکۆ | 60 | 1 | 100 |
The rounded values add up to 1.0001 and 100.01 instead of 1 and 100. That is a rounding error, not a counting mistake (see Rounding).
بەها نزیککراوەکان لە جیاتی 1 و 100 دەکەنە 1.0001 و 100.01. ئەمە ، نەک هەڵەی ژماردن (سەیری نزیککردنەوە بکە).
Running totals: cumulative frequencyکۆی بەردەوام: دووبارەبوونەوەی کەڵەکەبوو
Two more columns are often added. The cumulative frequency is a running total of f: add each class to all the classes before it. The cumulative relative frequency does the same with .
دوو ستوونی تر زۆرجار زیاد دەکرێن. کۆیەکی بەردەوامی fـە: هەر بخەرە سەر هەموو پێش خۆی. هەمان کار بە دەکات.
The running total of the relative frequencies: the share of all values that lie at or below a class's upper boundary. It is the divided by , and the last one is always 1 (100%).
کۆی کەڵەکەبووی کلاسەکانە: ئەو بەشەی هەموو نرخەکان کە لە سنووری سەرەوەی کلاسێکدان یان لە خوارییەوەن. دەکاتە دابەش بە و دوایینیان هەمیشە دەکاتە 1 (100%).
| Class | f | Cumulative f | Cumulative f/n |
|---|---|---|---|
| 60–74 | 4 | 4 | 0.0667 |
| 75–89 | 5 | 9 | 0.1500 |
| 90–104 | 9 | 18 | 0.3000 |
| 105–119 | 12 | 30 | 0.5000 |
| 120–134 | 16 | 46 | 0.7667 |
| 135–149 | 7 | 53 | 0.8833 |
| 150–164 | 7 | 60 | 1.0000 |
Read a row like this: 30 of the 60 values are 119 or less, which is . So half of the data lie below 119.5 — a first look at the median. The last row is always n (and 1). The next lesson builds the “less than” and “more than” cumulative tables and draws them as graphs: Histograms and cumulative frequency graphs.
ڕیزێک بەم شێوەیە بخوێنەرەوە: 30 لە 60 نرخەکە 119 یان کەمترن، واتە . کەواتە نیوەی لە خوار 119.5ـەوەن — یەکەم سەیرکردنی ناوەڕاستە. دوایین ڕیز هەمیشە nـە (و 1). وانەی داهاتوو خشتە کەڵەکەبووەکانی «کەمتر لە» و «زیاتر لە» دروست دەکات و وەک هێڵکاری دەیانکێشێت: هیستۆگرامەکان و هێڵکارییەکانی دووبارەبوونەوەی کەڵەکەبوو.
H.W 1: decimal data need continuous classesڕاهێنانی 1: دراوەی دەیی پێویستی بە کلاسی بەردەوام هەیە
Homework 1 of the notes gives 100 values with one decimal place and asks for a frequency table and the relative frequency of each class:
ڕاهێنانی ماڵەوەی 1ـی تێبینییەکان 100 نرخ بە یەک دەدات و داوای و بۆ هەر دەکات:
101, 65.3, 70.5, 83, 94, 55, 45, 61.3, 62.9, 66.5, 66.9, 68.3, 70, 73.2, 58.2, 59.9, 54.4, 58.7, 52.6, 51.8, 74.1, 58.5, 52, 66.3, 65.2, 67.1, 88.2, 89.1, 96.3, 61.1, 65, 63.1, 64.9, 66.2, 65.3, 69.2, 71.2, 60.1, 49.2, 55, 62.1, 68.1, 95.1, 88.2, 81.3, 82, 84, 75, 69.1, 52.9, 55.1, 66, 67, 65.2, 69.3, 75.1, 51.9, 54.8, 58.6, 52.4, 63, 65.1, 66.2, 78.3, 69.1, 71.2, 73.9, 72.1, 64.8, 65.9, 47.5, 61.3, 79.1, 73.8, 60.2, 82.4, 80.2, 75.1, 76.3, 80.1, 75.3, 81.1, 72, 73.6, 67, 70.3, 85, 88.1, 62.3, 58.1, 59.8, 79.2, 81.3, 74.5, 68.4, 72.1, 77.8, 65.2, 64.8, 50.6.
101، 65.3، 70.5، 83، 94، 55، 45، 61.3، 62.9، 66.5، 66.9، 68.3، 70، 73.2، 58.2، 59.9، 54.4، 58.7، 52.6، 51.8، 74.1، 58.5، 52، 66.3، 65.2، 67.1، 88.2، 89.1، 96.3، 61.1، 65، 63.1، 64.9، 66.2، 65.3، 69.2، 71.2، 60.1، 49.2، 55، 62.1، 68.1، 95.1، 88.2، 81.3، 82، 84، 75، 69.1، 52.9، 55.1، 66، 67، 65.2، 69.3، 75.1، 51.9، 54.8، 58.6، 52.4، 63، 65.1، 66.2، 78.3، 69.1، 71.2، 73.9، 72.1، 64.8، 65.9، 47.5، 61.3، 79.1، 73.8، 60.2، 82.4، 80.2، 75.1، 76.3، 80.1، 75.3، 81.1، 72، 73.6، 67، 70.3، 85، 88.1، 62.3، 58.1، 59.8، 79.2، 81.3، 74.5، 68.4، 72.1، 77.8، 65.2، 64.8، 50.6.
- Rangeمەودا
.
.
- Number of classesژمارەی کلاسەکان
(Sturges: ).
(: ).
- Widthپانی
, already whole.
، خۆی .
In Kurdish: a full frequency table for 30 decimal values: range, Sturges' number of classes, class width, tally marks, frequencies and midpoints.
بە کوردی: تەواو بۆ 30 نرخی : ، ژمارەی بە ، ، ، و .
In Kurdish; a worked example with decimal data and continuous classes.
بە کوردی؛ نموونەیەکی چارەسەرکراو بە و بەردەوام.
H.W 1: decimal data need continuous classesڕاهێنانی 1: دراوەی دەیی پێویستی بە کلاسی بەردەوام هەیە
A first try: classes with gapsهەوڵی یەکەم: کلاسەکان بە بۆشایی
A first try (the course owner's own homework) copied Example 1: whole-number classes with , that is 45–51, 52–58, …, 94–100, and wrote the frequencies 6, 14, 23, 24, 15, 10, 4, 4 with relative frequencies 6%, 14%, 23%, 24%, 15%, 10%, 4%, 4%. But these classes have gaps, and decimal values fall into them:
هەوڵێکی یەکەم (ڕاهێنانی خاوەنی کۆرسەکە خۆی) نموونەی 1ـی کۆپی کرد: بە ، واتە 45–51، 52–58، …، 94–100 و 6، 14، 23، 24، 15، 10، 4، 4 لەگەڵ 6%، 14%، 23%، 24%، 15%، 10%، 4%، 4% نووسی. بەڵام ئەم بۆشاییان هەیە و نرخە دەییەکان دەکەونە ناویانەوە:
Counted strictly, the whole-number classes hold only 81 of the 100 values (4, 9, 16, 22, 13, 10, 4, 3). The 19 values left out are 51.8, 51.9, 58.1, 58.2, 58.5, 58.6, 58.7, 65.1, 65.2, 65.2, 65.2, 65.3, 65.3, 65.9, 72.1, 72.1, 79.1, 79.2, 101. The frequencies the first try wrote down are right — but only for the corrected classes below.
بە وردی بژمێردرێن، تەنها 81 نرخ لە 100 نرخەکە دەگرنەوە (4، 9، 16، 22، 13، 10، 4، 3). ئەو 19 نرخەی دەمێننە دەرەوە بریتین لە 51.8، 51.9، 58.1، 58.2، 58.5، 58.6، 58.7، 65.1، 65.2، 65.2، 65.2، 65.3، 65.3، 65.9، 72.1، 72.1، 79.1، 79.2، 101. لە هەوڵی یەکەمدا دروستن — بەڵام تەنها بۆ ڕاستکراوەکانی خوارەوە.
H.W 1: decimal data need continuous classesڕاهێنانی 1: دراوەی دەیی پێویستی بە کلاسی بەردەوام هەیە
The fix: continuous classesچارەسەر: کلاسی بەردەوام
Decimal data are continuous, so the classes must touch. The owner's corrected homework gives a “Continuous Rule” in two forms:
دەیی دراوەی بەردەوامە، بۆیە دەبێت پێکەوە بلکێن. ڕاهێنانە ڕاستکراوەکەی خاوەنی کۆرسەکە «یاسای بەردەوام» بە دوو شێوە دەدات:
- Rule (1) gives 45–52, 52–59, …: neighbouring classes share a limit. Then you need an agreement: a value exactly on a shared limit (52, 66, 94 here) belongs to the class that starts there.
- Rule (2) gives 45.0–51.9, 52.0–58.9, …: subtract one unit of the last decimal place — 0.1 for one decimal, 0.01 for two. If the values have different numbers of decimals, use the most precise one (the smallest unit).
- The owner's note adds: if rule (2) causes a problem (for example the total no longer comes out right), use rule (1). Both give the same counts here.
- یاسای (1) 45–52، 52–59، … دەدات: دراوسێکان یەک سنووریان هاوبەشە. ئەوکات پێویستت بە ڕێککەوتنێکە: نرخێک کە ڕێک لەسەر سنوورێکی هاوبەشە (لێرەدا 52، 66، 94) سەر بەو کە لەوێوە دەست پێدەکات.
- یاسای (2) 45.0–51.9، 52.0–58.9، … دەدات: یەک یەکە لە دوایین کەم بکەرەوە — 0.1 بۆ یەک خانە، 0.01 بۆ دوو خانە. ئەگەر نرخەکان ژمارەی خانەی جیاوازیان هەبێت، وردترینیان بەکار بهێنە (بچووکترین یەکە).
- تێبینیی خاوەنی کۆرسەکە زیاد دەکات: ئەگەر یاسای (2) کێشەی دروست کرد (بۆ نموونە کۆکە ئیتر ڕاست دەرنەچوو)، یاسای (1) بەکار بهێنە. لێرەدا هەردووکیان هەمان ژماردن دەدەن.
Both rules lead to the same picture as class boundaries with one more decimal place than the data: 44.95, 51.95, 58.95, … No value with one decimal place can land exactly on such a boundary, so there is never a doubt where it belongs. This is the standard method in statistics books (for example OpenStax).
هەردوو یاسا دەگەنە هەمان وێنەی کە یەک زیاتر لە هەیە: 44.95، 51.95، 58.95، … هیچ نرخێکی یەک خانەیی ناتوانێت ڕێک بکەوێتە سەر سنوورێکی لەم شێوەیە، بۆیە هەرگیز گومان نییە سەر بە کوێیە. ئەمە ڕێگا ستانداردەکەی کتێبەکانی (بۆ نموونە OpenStax).
H.W 1: decimal data need continuous classesڕاهێنانی 1: دراوەی دەیی پێویستی بە کلاسی بەردەوام هەیە
The last class must hold the largest valueدوایین کلاس دەبێت گەورەترین نرخ لە خۆ بگرێت
| Class (rule 2) (یاسای 2) | Boundaries | f | f/n | % |
|---|---|---|---|---|
| 45.0–51.9 | 44.95–51.95 | 6 | 0.06 | 6 |
| 52.0–58.9 | 51.95–58.95 | 14 | 0.14 | 14 |
| 59.0–65.9 | 58.95–65.95 | 23 | 0.23 | 23 |
| 66.0–72.9 | 65.95–72.95 | 24 | 0.24 | 24 |
| 73.0–79.9 | 72.95–79.95 | 15 | 0.15 | 15 |
| 80.0–86.9 | 79.95–86.95 | 10 | 0.10 | 10 |
| 87.0–93.9 | 86.95–93.95 | 4 | 0.04 | 4 |
| 94.0–101.0 | 93.95–101.05 | 4 | 0.04 | 4 |
| Totalکۆ | 100 | 1.00 | 100 |
Because , each relative frequency is simply , and the percentage equals . The class marks from the boundaries are 48.45, 55.45, …, 90.45 and, for the stretched last class, 97.5.
چونکە ـە، هەر بە سادەیی ـە و یەکسانە بە . لە 48.45، 55.45، …، 90.45ن و بۆ دوایین درێژکراوە 97.5.
Common mistakesهەڵە باوەکان
| Mistakeهەڵە | What goes wrongچی تێک دەچێت | Fixچارەسەر |
|---|---|---|
| Rounding L down L بەرەو خوار | The classes stop before the largest value. پێش گەورەترین نرخ دەوەستن. | Round L up; check L بەرەو سەرەوە نزیک بکەرەوە؛ بپشکنە |
| Whole-number classes for decimal data بۆ دەیی | Values like 51.8 fall into gaps.نرخی وەک 51.8 دەکەونە بۆشاییەوە. | Continuous classes or boundaries بەردەوام یان |
| Classes 45–52, 52–59 with no agreement 45–52، 52–59 بێ ڕێککەوتن | 52 could be counted twice.52 دەکرێت دوو جار بژمێردرێت. | A shared limit belongs to the class that starts thereسنووری هاوبەش سەر بەو کە لەوێوە دەست پێدەکات |
| Last class misses the maximumدوایین گەورەترین نرخی تێدا نییە | 101 is not counted.101 ناژمێردرێت. | Stretch the last class or add oneدوایین درێژ بکەرەوە یان یەکێکی زیاد بکە |
| Width پانی | , but the width is 15.، بەڵام پانییەکە 15ـە. | Upper boundary − lower boundaryجیاوازیی هەردوو |
| Not checking نەپشکنینی | A lost or doubled value goes unnoticed.نرخێکی ونبوو یان دووجارە ناناسرێتەوە. | Always add up the f columnهەمیشە ستوونی f کۆ بکەرەوە |
| Cutting off decimals in ژمارە دەییەکان لە | 6.6666 instead of 6.676.6666 لە جیاتی 6.67 | Round (4 places or 2 for %)نزیک بکەرەوە (4 خانە یان 2 بۆ %) |
Exercisesڕاهێنانەکان
Make the full frequency table of the 100 values of H.W 1: range, number of classes (Yule), width, continuous classes with boundaries, frequencies and relative frequencies. Check that .
تەواو بۆ 100 نرخەکەی ڕاهێنانی 1 دروست بکە: ، ژمارەی ()، پانی، بەردەوام لەگەڵ ، و . بپشکنە کە .
Show answerوەڵامەکە پیشان بدە
, , . Classes 45.0–51.9, 52.0–58.9, …, 87.0–93.9, 94.0–101.0 (boundaries 44.95, 51.95, …, 93.95, 101.05). Frequencies 6, 14, 23, 24, 15, 10, 4, 4 (); relative frequencies 0.06, 0.14, 0.23, 0.24, 0.15, 0.10, 0.04, 0.04 — the full table is in The last class must hold the largest value.
، ، . 45.0–51.9، 52.0–58.9، …، 87.0–93.9، 94.0–101.0 ( 44.95، 51.95، …، 93.95، 101.05). 6، 14، 23، 24، 15، 10، 4، 4 ()؛ 0.06، 0.14، 0.23، 0.24، 0.15، 0.10، 0.04، 0.04 — خشتە تەواوەکە لە دوایین کلاس دەبێت گەورەترین نرخ لە خۆ بگرێتدایە.
A student used the classes 45–51, 52–58, 59–65, … for H.W 1. Find three values of the data that fit in no class, and explain how to fix the table.
قوتابییەک بۆ ڕاهێنانی 1 45–51، 52–58، 59–65، … بەکار هێنا. سێ نرخی بدۆزەرەوە کە لە هیچ جێیان نابێتەوە و ڕوونی بکەرەوە خشتەکە چۆن چاک دەکرێت.
Show answerوەڵامەکە پیشان بدە
For example 51.8 (between 51 and 52), 65.3 (between 65 and 66) and 101 (after 100). Use continuous classes: with shared limits going to the upper class, or , i.e. boundaries 44.95, 51.95, …; and let the last class reach 101.
بۆ نموونە 51.8 (لە نێوان 51 و 52)، 65.3 (لە نێوان 65 و 66) و 101 (دوای 100). بەردەوام بەکار بهێنە: کە سنوورە هاوبەشەکان دەچن بۆ سەرەوە، یان ، واتە 44.95، 51.95، …؛ و با دوایین بگاتە 101.
Exercisesڕاهێنانەکان
More exercisesڕاهێنانی زیاتر
At a taxi garage, 24 passengers recorded how many minutes they waited: 3, 7, 12, 5, 9, 15, 4, 8, 11, 6, 14, 2, 10, 7, 9, 13, 5, 8, 6, 12, 18, 4, 9, 7. Build a frequency table with Sturges' rule: range, m, L, classes, class marks, frequencies, relative frequencies (4 places) and cumulative frequencies.
لە گەراجێکی تاکسی، 24 سەرنشین تۆماریان کرد چەند خولەک چاوەڕێ بوون: 3، 7، 12، 5، 9، 15، 4، 8، 11، 6، 14، 2، 10، 7، 9، 13، 5، 8، 6، 12، 18، 4، 9، 7. بە دروست بکە: ، m، L، ، ، ، (4 خانە) و .
Show answerوەڵامەکە پیشان بدە
. Sturges: (Yule gives too). ; check .
. : ( دەدات). ؛ پشکنین .
| Class | Class mark | f | f/n | Cumulative f |
|---|---|---|---|---|
| 2–4 | 3 | 4 | 0.1667 | 4 |
| 5–7 | 6 | 7 | 0.2917 | 11 |
| 8–10 | 9 | 6 | 0.2500 | 17 |
| 11–13 | 12 | 4 | 0.1667 | 21 |
| 14–16 | 15 | 2 | 0.0833 | 23 |
| 17–19 | 18 | 1 | 0.0417 | 24 |
Change the Python program of Example 1 so that it counts the 100 decimal values of H.W 1 into the 8 continuous classes that start at 45 and are 7 wide. Make sure that 101 is counted.
بەرنامەی Pythonـی نموونەی 1 بگۆڕە بۆ ئەوەی 100 نرخە دەییەکەی ڕاهێنانی 1 بۆ ناو 8 بەردەوامەکە بژمێرێت کە لە 45 دەست پێدەکەن و پانییان 7ـە. دڵنیا بە کە 101 دەژمێردرێت.
Show answerوەڵامەکە پیشان بدە
data = [101, 65.3, 70.5, 83, 94, 55, 45, 61.3, 62.9, 66.5, 66.9, 68.3, 70, 73.2,
        58.2, 59.9, 54.4, 58.7, 52.6, 51.8, 74.1, 58.5, 52, 66.3, 65.2, 67.1, 88.2,
        89.1, 96.3, 61.1, 65, 63.1, 64.9, 66.2, 65.3, 69.2, 71.2, 60.1, 49.2, 55,
        62.1, 68.1, 95.1, 88.2, 81.3, 82, 84, 75, 69.1, 52.9, 55.1, 66, 67, 65.2,
        69.3, 75.1, 51.9, 54.8, 58.6, 52.4, 63, 65.1, 66.2, 78.3, 69.1, 71.2, 73.9,
        72.1, 64.8, 65.9, 47.5, 61.3, 79.1, 73.8, 60.2, 82.4, 80.2, 75.1, 76.3, 80.1,
        75.3, 81.1, 72, 73.6, 67, 70.3, 85, 88.1, 62.3, 58.1, 59.8, 79.2, 81.3, 74.5,
        68.4, 72.1, 77.8, 65.2, 64.8, 50.6]

lowest, width, m = 45, 7, 8
freq = [0] * m
for x in data:
    k = int((x - lowest) // width)
    k = min(k, m - 1)          # 101 would be class 8: keep it in the last class
    freq[k] += 1

print(freq, sum(freq))[6, 14, 23, 24, 15, 10, 4, 4] 100
Explain the codeڕوونکردنەوەی کۆدەکە
- Lineدێڕی 13
(x - 45) // 7gives 0 to 7 for every value except 101, which would give 8.(x - 45) // 7بۆ هەموو نرخێک 0 تا 7 دەدات جگە لە 101 کە 8 دەدات.- Lineدێڕی 14
min(k, m - 1)keeps the largest value in the last class — the owner's “stretch the last class”.min(k, m - 1)گەورەترین نرخ لە دوایین دەهێڵێتەوە — «دوایین درێژ بکەرەوە»ـی خاوەنی کۆرسەکە.
Summaryپوختە
- Rangeمەودا
- Number of classesژمارەی کلاسەکان
or , rounded to a whole number.
یان ، بۆ نزیک دەکرێتەوە.
- Widthپانی
, always rounded up.
، هەمیشە بەرەو سەرەوە نزیک دەکرێتەوە.
- Classesکلاسەکان
Whole numbers: . Decimals: continuous classes, boundaries with one extra decimal. The last class must hold the largest value.
: . ژمارەی دەیی: بەردەوام، بە یەک خانەی زیاتر. دوایین دەبێت گەورەترین نرخ لە خۆ بگرێت.
- Countبژمێرە
Tally once through the data; check .
یەک جار بە ناو دابنێ؛ بپشکنە.
- Extra columnsستوونی زیادە
Class mark , relative frequency , cumulative frequency (running total).
، ، (کۆی بەردەوام).
Why must the class width be rounded up?بۆچی دەبێت پانیی کلاس بەرەو سەرەوە نزیک بکرێتەوە؟
So that m classes of width L reach from the smallest to the largest value.
بۆ ئەوەی m بە پانیی L لە بچووکترین نرخەوە بگەنە گەورەترینیان.
What are the boundaries of the class 60–74 for whole-number data?سنوورە ڕاستەقینەکانی کلاس بۆ کلاسی 60–74 بۆ دراوەکە ژمارە تەواوەکان چین؟
59.5 and 74.5.
59.5 و 74.5.
Why did whole-number classes fail for H.W 1?بۆچی کلاسی ژمارە تەواوەکان لە ڕاهێنانی 1دا سەرکەوتوو نەبوو؟
The data have decimals, so values such as 51.8 fell into the gaps between classes, and 101 was past the last class: only 81 of 100 values were counted.
ژمارەی دەیی هەیە، بۆیە نرخی وەک 51.8 کەوتنە بۆشایی نێوان و 101 دوای کۆتا بوو: تەنها 81 لە 100 نرخ ژمێردران.
Lesson complete!وانەکە تەواو بوو!
Well done. Review the key terms, then go on to the next lesson.دەستخۆش. سەیرێکی زاراوە سەرەکییەکان بکەرەوە، پاشان بڕۆ بۆ وانەی داهاتوو.
Key termsزاراوە سەرەکییەکان
Histograms and Cumulative Frequency Graphsهیستۆگرامەکان و هێڵکارییەکانی دووبارەبوونەوەی کەڵەکەبوو
Related lecturesوانە پەیوەندیدارەکان
References and further readingسەرچاوەکان و خوێندنەوەی زیاتر
- OpenStax, Introductory Statistics 2e, 2.2 Histograms, Frequency Polygons, and Time Series Graphs (starting point and boundaries one decimal place beyond the data; 5–15 classes)
- OpenStax, Introductory Statistics 2e, 1.3 Frequency, Frequency Tables, and Levels of Measurement (relative and cumulative relative frequency)
- OpenStax, Introductory Statistics 2e, 1.2 Data, Sampling, and Variation in Data and Sampling (discrete and continuous data)
- Wikipedia: Histogram — Number of bins and width (Sturges' formula, square-root choice, Rice rule)
This lecture is a first edition. The Kurdish text and terminology are waiting for review by Kurdish IT teachers.ئەم وانەیە چاپی یەکەمە. دەقە کوردییەکە و زاراوەکانی چاوەڕێی پێداچوونەوەی مامۆستایانی کوردی بواری IT ن.