Chapterبەش 3 · Lectureوانە 3.2
Variance and Standard Deviationلێکنەچوون و لادانی پێوانەیی
Squared deviations give the variance and its square root the standard deviation: population (N) and sample formulas, why a sample divides by (with a simulation), the corrected grouped formulas, the course's Example 5 and H.W 1, S.D. versus variance, the effect of adding and multiplying, and Python's pvariance vs variance.
دووجای دەدات و : فۆرمولەکانی (N) و ()، بۆچی دابەشی دەکات (لەگەڵ )، فۆرمولە پۆلێنکراوە ڕاستکراوەکان، نموونەی 5 و ئەرکی ماڵەوەی 1ی کۆرسەکە، S.D بەرامبەر ، کاریگەریی زیادکردن و لێکدان و pvariance بەرامبەر variance لە Python.
What you will learnچی فێر دەبیت
- Compute the variance and standard deviation of raw and grouped data.
- Choose between the population formula (divide by N) and the sample formula (divide by ), and explain why.
- Explain the difference between the variance and the standard deviation, including units.
- Predict how adding a constant or multiplying by k changes the spread.
- Use statistics.pvariance, variance, pstdev and stdev in Python.
- و بۆ خاو و پۆلێنکراو بژمێریت.
- لە نێوان فۆرمولەی (دابەشکردن بە N) و فۆرمولەی (دابەشکردن بە ) هەڵبژێریت و هۆکارەکەی ڕوون بکەیتەوە.
- جیاوازیی نێوان و ڕوون بکەیتەوە، یەکەکانیش لەگەڵیدا.
- پێشبینی بکەیت زیادکردنی یان لێکدان لە k چۆن دەگۆڕێت.
statistics.pvariance،variance،pstdevوstdevلە Python بەکاربهێنیت.
From absolute values to squaresلە نرخی ڕووتەوە بۆ دووجا
In Range and mean deviation we saw that deviations from the mean always add up to 0, so their signs must be removed. The mean deviation removes them with absolute values. The variance removes them by squaring: it is the mean of the squared deviations. The standard deviation is its square root.
لە مەودا و لادانی نێوانەیی بینیمان کە کۆی لە هەمیشە 0ـە، بۆیە دەبێت نیشانەکانیان لاببرێن. بە لایان دەبات. بە دووجاکردن لایان دەبات: دووجای . ئەوە.
The mean of the squared from the mean: for a population. For a random variable, .
دووجای لە : بۆ . بۆ ، .
The square root of the : . It measures spread in the same units as the data.
ڕەگی دووجای : . پەرتبوون بە هەمان یەکەی دراوەکە دەپێوێت.
Why squares and not absolute values? Three reasons:
بۆچی دووجا و نەک ؟ سێ هۆکار:
- A square is never negative, so the signs disappear: .
- Big deviations count much more: a deviation of 4 adds 16, four times as much as a deviation of 2. Values far from the mean are punished.
- The algebra is smooth: the mean is exactly the point that makes the sum of squared deviations smallest, and squares work well in formulas, probability and finance.
- دووجا هەرگیز نەرێنی نییە، بۆیە نیشانەکان نامێنن: .
- گەورە زۆر زیاتر هەژمار دەکرێن: 4، 16 زیاد دەکات، چوار هێندەی 2. نرخە دوورەکان سزا دەدرێن.
- جەبرەکەی ڕێکە: ڕێک ئەو خاڵەیە کە کۆی دووجای بچووکترین دەکات و دووجا لە فۆرمولە، و دارایدا باش کار دەکات.
Why variance squares the deviations instead of using absolute values, and why only n − 1 deviations are free (degrees of freedom).
بۆچی دووجا دەکات لە جیاتی بەکارهێنانی ، هەروەها بۆچی تەنها ئازادن ().
Watch 2:39–6:55: why we square the deviations
لە 2:39 تا 6:55 سەیر بکە: بۆچی دووجا دەکەین.
Watch the squares add upسەیری کۆبوونەوەی دووجاکان بکە
Here is the whole idea on the course's Example 5, the sample 9, 8, 6, 5, 7 (mean 7). For each value, draw its deviation, build a square on it, and add the square's area to a running total.
ئەمە هەموو بیرۆکەکەیە لەسەر نموونەی 5ی کۆرسەکە، 9، 8، 6، 5، 7 ( 7). بۆ هەر نرخێک، بکێشە، چوارگۆشەیەکی لەسەر دروست بکە و ڕووبەری چوارگۆشەکە بخەرە سەر کۆی ڕۆیشتوو.
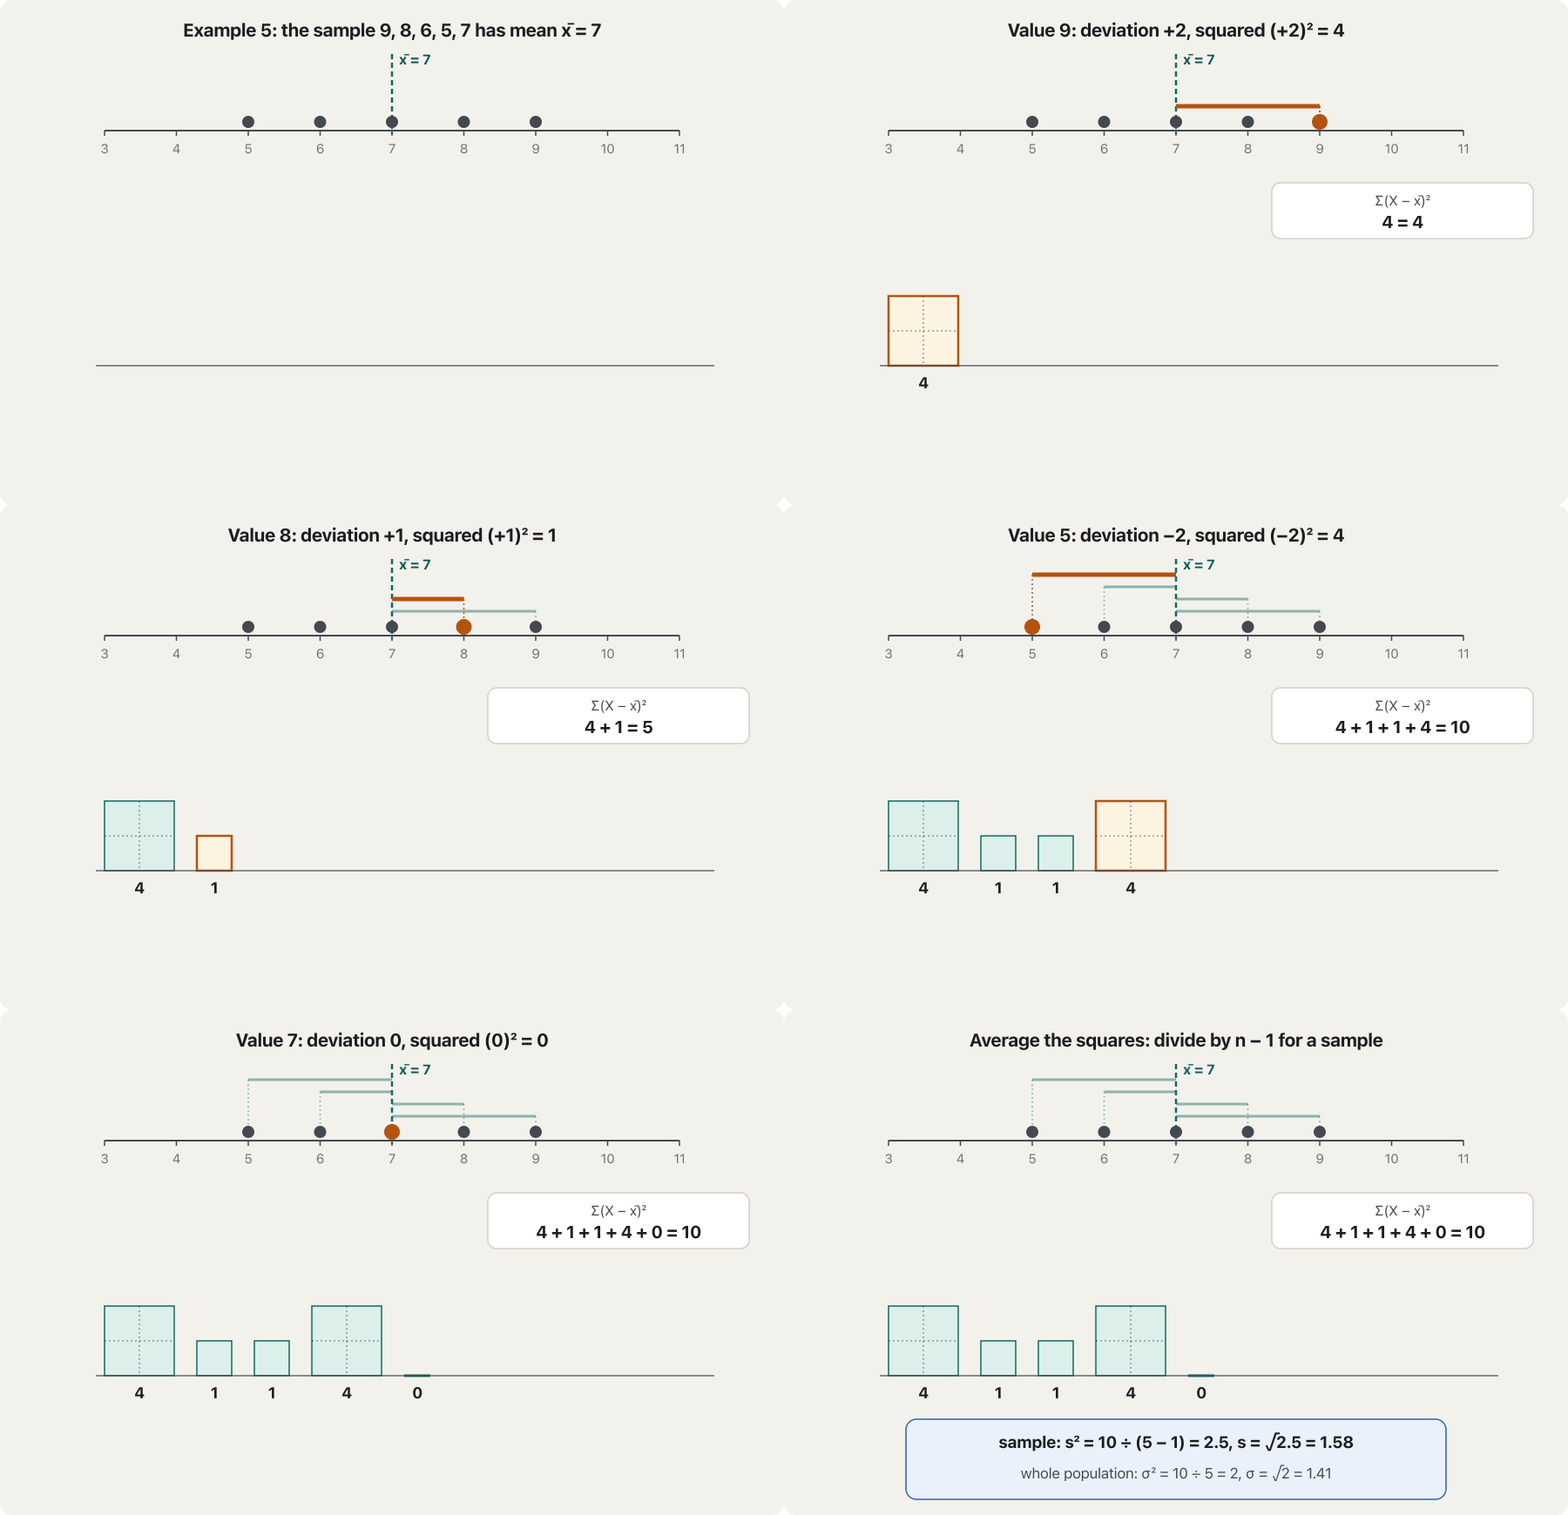
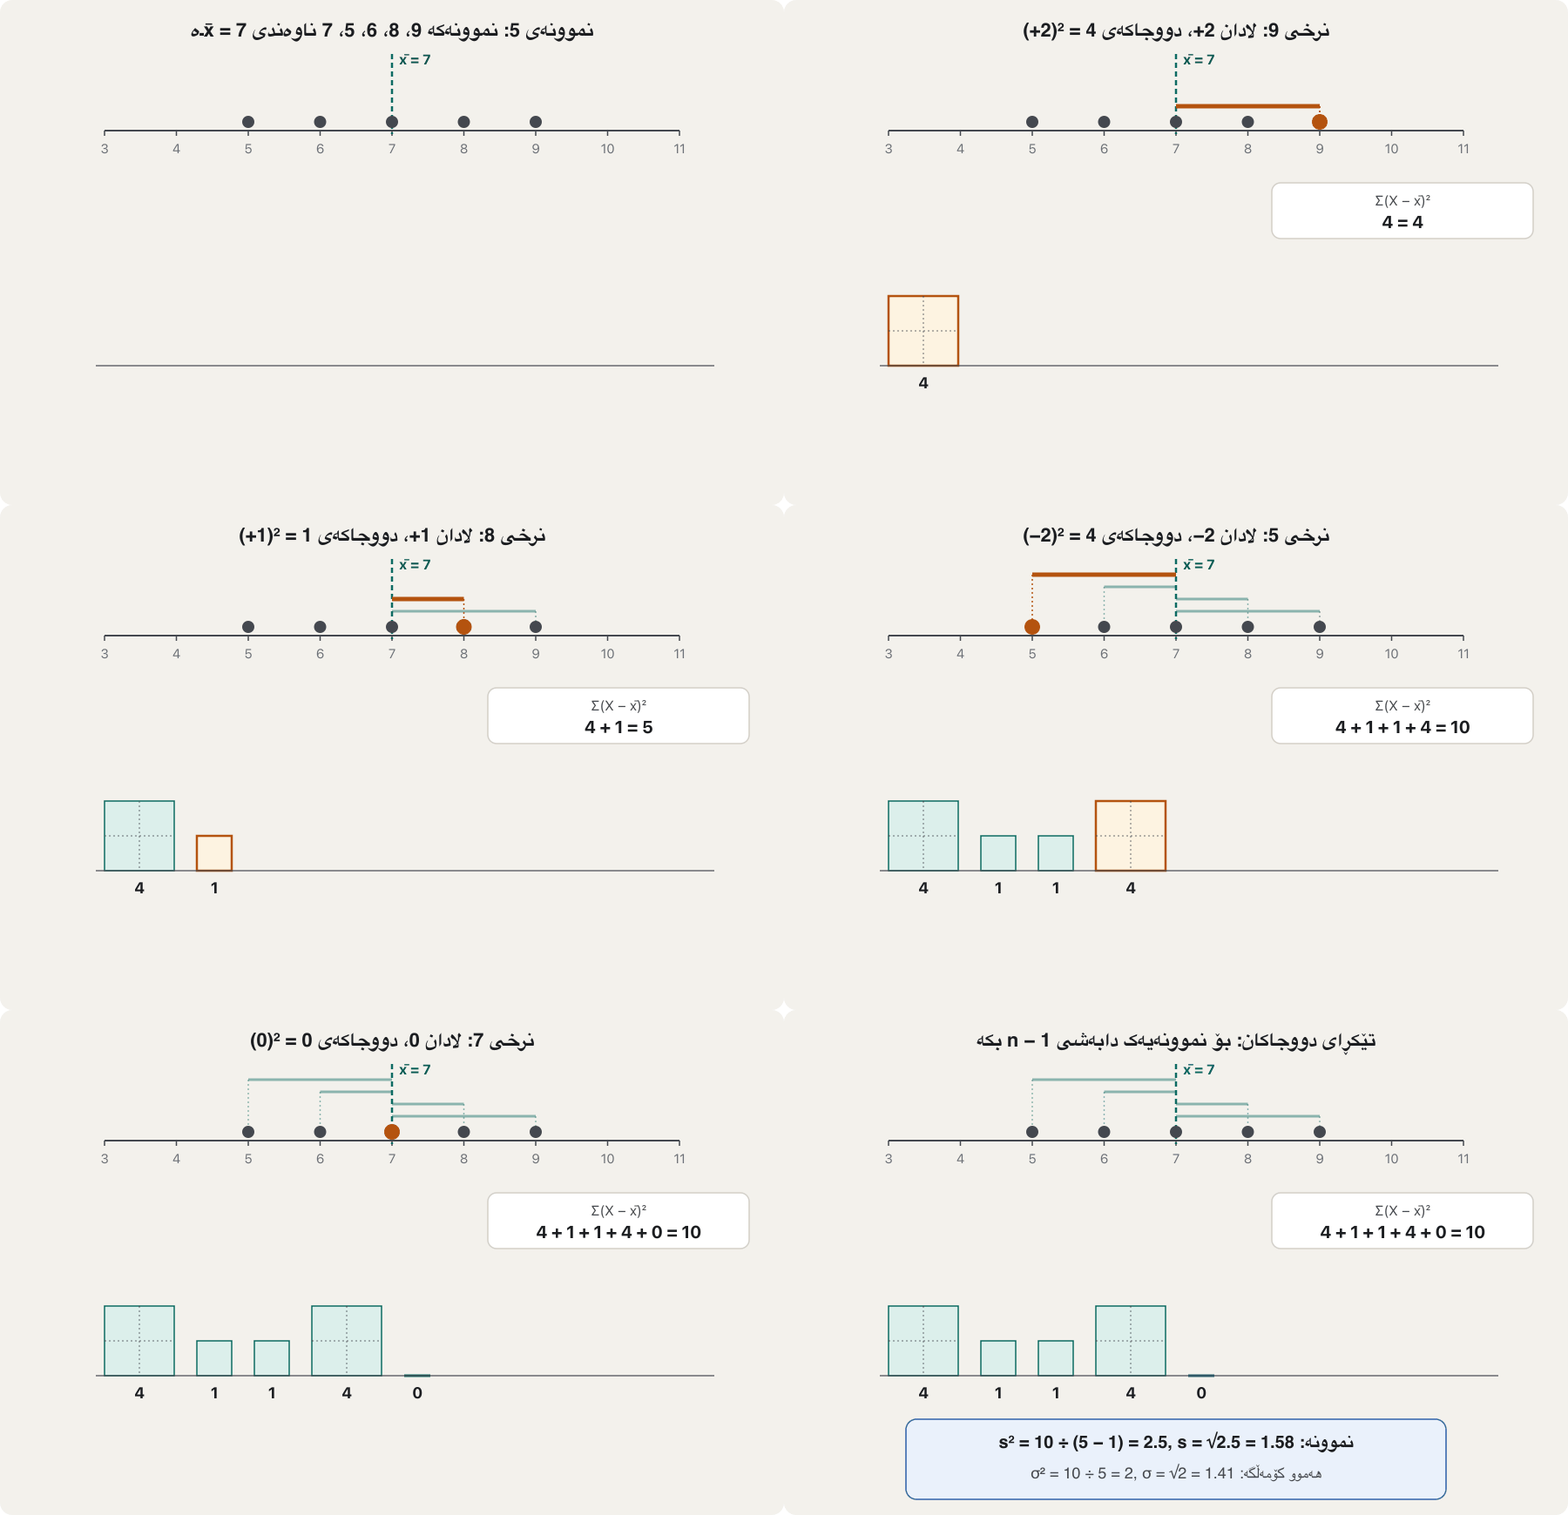
This picture also explains the name: the standard deviation is the side of the “average square”. A variance of 2.5 is a square of area 2.5; its side is , back in the units of the data.
ئەم وێنەیە ناوەکەش ڕوون دەکاتەوە: لای «چوارگۆشە تێکڕاییەکە»یە. 2.5 چوارگۆشەیەکە بە ڕووبەری 2.5؛ لاکەی ـە، دیسان بە یەکەی .
The population formulas: and فۆرمولەکانی کۆمەڵگە: و
The course defines the standard deviation as the positive square root of the arithmetic mean of the squared deviations of the values from their mean. It is usually written (the Greek letter sigma). When the data are a whole population of N values with mean :
کۆرسەکە وا پێناسە دەکات: ئەرێنیی دووجای نرخەکان لە . زۆرجار بە دەنووسرێت (پیتی گریکیی سیگما). کاتێک هەموو N نرخە بە :
Population variance and population standard deviation (ungrouped data).
و ().
- Remark 1. If the deviations are measured from the arithmetic mean, the root-mean-square deviation is exactly the standard deviation (square → mean → root).
- Remark 2. The square of the standard deviation, , is called the variance.
- تێبینیی 1. ئەگەر لە بپێورێن، ڕەگی تێکڕای دووجای ڕێک (دووجا ← تێکڕا ← ڕەگ).
- تێبینیی 2. دووجای ، ، پێی دەوترێت .
The sample formulas: divide by فۆرمولەکانی نموونە: دابەشی بکە
Usually we do not have the whole population, only a sample of n values, and we want to learn about the population from it. Then the sum of squares is divided by :
زۆرجار هەموو نییە، تەنها n نرخ و دەمانەوێت لە ڕێگەیەوە شت دەربارەی بزانین. ئەو کاتە کۆی دووجاکان دابەشی دەکرێت:
Sample variance and sample standard deviation.
و .
| Measureپێوەر | Population (parameter) () | Sample (statistic) () |
|---|---|---|
| Sizeقەبارە | ||
| Mean | ||
| Variance | ||
| Standard deviation | ||
| Python | statistics.pvariance, pstdev | statistics.variance, stdev |
The notes write the sample S.D. as S (capital); many books use a small s. Both mean the same thing. Why and not n? The next screens answer that.
تێبینییەکان بە S (گەورە) دەنووسن؛ زۆر کتێب s ـی بچووک بەکار دەهێنن. هەردووکیان یەک واتایان هەیە. بۆچی و نەک n؟ پەڕەکانی داهاتوو وەڵام دەدەنەوە.
Why ?بۆچی ؟
The notes give both formulas but do not say why the sample one divides by . This is one of the most common questions in statistics, so the next four screens answer it from different sides: an intuition, a computer simulation, degrees of freedom, and a rule of thumb.
تێبینییەکان هەردوو فۆرمولەکە دەدەن، بەڵام ناڵێن بۆچی هی دابەشی دەکات. ئەمە یەکێکە لە باوترین پرسیارەکانی ، بۆیە چوار پەڕەی داهاتوو لە چەند لایەکەوە وەڵامی دەدەنەوە: تێگەیشتنێکی سادە، ، و ڕێسایەکی خێرا.
Why ?بۆچی ؟
A sample hugs its own meanنموونە لە ناوەندی خۆی نزیکە
The deviations in are measured from the sample mean , not from the true mean , which we do not know. But is computed from these very values, so it sits in their middle: no other point gives a smaller sum of squared deviations.
لە دا لە دەپێورێن، نەک لە ڕاستەقینە کە نایزانین. بەڵام لە هەر ئەم نرخانەوە ژمێردراوە، بۆیە لە ناوەڕاستیانە: هیچ خاڵێکی تر کۆیەکی بچووکتری دووجای نادات.
- An extreme sampleنموونەیەکی توند
A fair die has and . Roll it twice and get 6 and 6.
بەردەزارێکی دادپەروەر و ی هەیە. دوو جار فڕێی بدە و 6 و 6 وەربگرە.
- From its own meanلە ناوەندی خۆیەوە
, so . Dividing by n gives a variance of 0: “no spread at all”.
، بۆیە . دابەشکردن بە n 0 دەدات: «هیچ نییە».
- From the true meanلە ناوەندی ڕاستەقینەوە
. Measured from 3.5 the two rolls are clearly spread.
. کە لە 3.5ەوە بپێورێت، دوو فڕێدانەکە بە ڕوونی پەرتن.
This happens to every sample, a little or a lot: . So dividing by n gives a variance that is too small on average. Dividing by the slightly smaller number makes up for it exactly. This fix is called Bessel's correction.
ئەمە بۆ هەموو ڕوو دەدات، کەم یان زۆر: . بۆیە دابەشکردن بە n دەدات کە بە تێکڕا زۆر بچووکە. دابەشکردن بە ژمارە کەمێک بچووکترەکەی ڕێک قەرەبووی دەکاتەوە. ئەم چاککردنە پێی دەوترێت .
Dividing by instead of in the . The sample's values sit closer to their own mean than to the true mean, so dividing by would underestimate the spread.
دابەشکردن بە لە جیاتی لە . نرخەکانی نموونە لە تێکڕای خۆیانەوە نزیکترن تا لە تێکڕای ڕاستەقینە، بۆیە دابەشکردن بە پەرتبوون کەمتر لە ڕاستی دەخەمڵێنێت.
Each value pulls the sample mean towards itself, so deviations from x̄ come out too small; dividing by n − 1 fixes this.
هەر نرخێک بەرەو خۆی ڕادەکێشێت، بۆیە لە زۆر بچووک دەردەچن؛ دابەشکردن بە ئەمە چاک دەکاتەوە.
Whole video: why a sample divides by n − 1
هەموو ڤیدیۆکە: بۆچی دابەش بە دەکرێت.
Why ?بۆچی ؟
A simulation: average many samplesهاوشێوەسازییەک: تێکڕای زۆر نموونە
Let a computer check the claim. It rolls a fair die n times, computes the variance of these n rolls both ways (dividing by n and by ), and repeats this 100,000 times. Then it averages each kind of estimate and compares it with the true variance 2.917.
با ئەم بانگەشەیە بپشکنێت. بەردەزارێکی دادپەروەر n جار فڕێ دەدات، ئەم n فڕێدانە بە هەردوو ڕێگا دەژمێرێت (دابەشکردن بە n و بە ) و ئەمە 100,000 جار دووبارە دەکاتەوە. پاشان تێکڕای هەر جۆرێکی خەمڵاندن وەردەگرێت و بەراوردی دەکات لەگەڵ ڕاستەقینەی 2.917.
import random

random.seed(1)            # the same "random" rolls every time you run it
TRUE_VAR = 35 / 12        # variance of one fair die: 2.917

def two_estimates(sample):
    n = len(sample)
    mean = sum(sample) / n
    ss = sum((x - mean) ** 2 for x in sample)   # sum of squared deviations
    return ss / n, ss / (n - 1)

for n in (2, 3, 5, 10):
    trials = 100_000
    total_n = total_n1 = 0
    for _ in range(trials):
        sample = [random.randint(1, 6) for _ in range(n)]
        by_n, by_n1 = two_estimates(sample)
        total_n += by_n
        total_n1 += by_n1
    print(f"n = {n:>2}: divide by n -> {total_n / trials:.3f}, "
f"divide by n-1 -> {total_n1 / trials:.3f} (true {TRUE_VAR:.3f})")n = 2: divide by n -> 1.457, divide by n-1 -> 2.915 (true 2.917) n = 3: divide by n -> 1.947, divide by n-1 -> 2.920 (true 2.917) n = 5: divide by n -> 2.335, divide by n-1 -> 2.919 (true 2.917) n = 10: divide by n -> 2.623, divide by n-1 -> 2.915 (true 2.917)
Explain the codeڕوونکردنەوەی کۆدەکە
- Lineدێڕی 3
A fixed seed makes the “random” rolls repeatable, so you get the same output.
چەسپاو فڕێدانە «هەڕەمەکی»یەکان دووبارەکراوە دەکات، بۆیە هەمان دەرئەنجام وەردەگریت.
- Lineدێڕی 6-10
Both estimates use the same sum of squares; only the divisor differs.
هەردوو خەمڵاندن هەمان کۆی دووجاکان بەکار دەهێنن؛ تەنها دابەشکەرەکە جیاوازە.
The simulation agrees with the exact chart: with the average estimate is only of the truth (half of it when ); with it lands on 2.917. The gap shrinks as n grows: for the two formulas differ by only 1%.
لەگەڵ وردەکەدا ڕێکە: بە تێکڕای خەمڵاندن تەنها ی ڕاستییەکەیە (نیوەی کاتێک )؛ بە دەکەوێتە سەر 2.917. بە گەورەبوونی n جیاوازییەکە بچووک دەبێتەوە: بۆ دوو فۆرمولەکە تەنها 1% جیاوازن.
Why ?بۆچی ؟
Degrees of freedomپلەکانی ئازادی
A second way to see : the deviations from always add up to 0. In Example 5 the first four deviations are ; the fifth must be 0. Only deviations are free; the last one is fixed by the others. We say the sample variance has degrees of freedom, and we share the sum of squares among those free pieces.
ڕێگای دووەم بۆ بینینی : کۆی لە هەمیشە 0ـە. لە نموونەی 5دا چوار یەکەم ن؛ پێنجەمیان دەبێت 0 بێت. تەنها ئازادن؛ دوایینیان بەهۆی ئەوانی ترەوە چەسپاوە. دەڵێین هەیە و کۆی دووجاکان بەسەر ئەو پارچە ئازادانەدا دابەش دەکەین.
The number of values that are still free to vary. For the it is : the from must add up to 0, so once of them are known, the last one is fixed.
ژمارەی ئەو نرخانەی کە هێشتا ئازادن بگۆڕێن. بۆ دەکاتە : کۆی لە دەبێت 0 بێت، بۆیە کاتێک یان زانرا، دوایینیان چەسپاوە.
Five friends spent 10,000 dinars in total. The first four can say any amount they paid — 3,000, 1,000, 2,500, 1,500 — but then the fifth has no choice: he paid exactly 2,000. Five payments, only four free choices.
پێنج هاوڕێ بە گشتی 10,000 دینار خەرج دەکەن. چوارەکەی یەکەم دەتوانن هەر بڕێک بڵێن کە داویانە — 3,000، 1,000، 2,500، 1,500 — بەڵام پاشان پێنجەم هیچ هەڵبژاردنێکی نییە: ڕێک 2,000ی داوە. پێنج پارەدان، تەنها چوار هەڵبژاردنی ئازاد.
Where the analogy stops workingسنووری ئەم نموونەیە
In statistics the fixed total is 0 (the sum of deviations), not a bill; the idea of “one value is decided by the rest” is the same.
لە کۆ چەسپاوەکە 0ـە (کۆی )، نەک پارەی چایخانە؛ بیرۆکەی «یەک نرخ بەهۆی ئەوانی ترەوە دیاری دەکرێت» هەمان شتە.
Why variance squares the deviations instead of using absolute values, and why only n − 1 deviations are free (degrees of freedom).
بۆچی دووجا دەکات لە جیاتی بەکارهێنانی ، هەروەها بۆچی تەنها ئازادن ().
Watch 10:47–13:46: what degrees of freedom mean
لە 10:47 تا 13:46 سەیر بکە: چ واتایەکیان هەیە.
Why ?بۆچی ؟
Which formula should I use?کام فۆرمولە بەکاربهێنم؟
- Your values are the whole group you care about (all students of one class, all days of a month): divide by N (, Python
pvariance). - Your values are a sample used to estimate a bigger group: divide by (, Python
variance). - If a test or a lecturer says which one, follow it. In this course the exercises name the version (“population”, “sample”).
- نرخەکانت هەموو ئەو کۆمەڵەیەن کە گرنگە بۆت (هەموو قوتابییانی پۆلێک، هەموو ڕۆژەکانی مانگێک): دابەشی N بکە (،
pvarianceلە Python). - نرخەکانت بۆ خەمڵاندنی کۆمەڵەیەکی گەورەتر: دابەشی بکە (،
varianceلە Python). - ئەگەر تاقیکردنەوەیەک یان مامۆستایەک بڵێت کامیان، پەیڕەوی بکە. لەم کۆرسەدا ڕاهێنانەکان وەشانەکە ناو دەبەن («»، «»).
Example 5: a sample of five numbersنموونەی 5: نموونەیەکی پێنج ژمارەیی
Find the variance and the S.D. of the sample 9, 8, 6, 5, 7. First .
و 9، 8، 6، 5، 7 بدۆزەرەوە. سەرەتا .
| 9 | 8 | 6 | 5 | 7 | Σ | |
|---|---|---|---|---|---|---|
| 2 | 1 | 0 | 0 | |||
| 4 | 1 | 1 | 4 | 0 | 10 |
The deviation row adds up to 0, a quick check that the mean was right.
ڕیزی کۆی 0ـە، پشکنینێکی خێرا کە دروست بووە.
If the five numbers were a whole population instead, the same sum would be divided by 5: and .
ئەگەر پێنج ژمارەکە لە جیاتی ئەوە هەموو بوونایە، هەمان کۆ دابەشی 5 دەکرا: و .
A shortcut for hand calculationڕێگایەکی کورت بۆ ژماردنی دەستی
Subtracting the mean from every value is slow when the mean is a long decimal. Expanding the square gives a shortcut that needs only and :
کەمکردنەوەی لە هەموو نرخێک هێواشە کاتێک ژمارەیەکی دەیی درێژە. کردنەوەی دووجاکە ڕێگایەکی کورت دەدات کە تەنها و ی پێویستە:
Example 5: and , so the sum of squares is , as before.
نموونەی 5: و ، بۆیە کۆی دووجاکان ـە، وەک پێشوو.
Grouped data: put the frequencies inدراوەی پۆلێنکراو: دووبارەبوونەوەکان دابنێ
In a frequency table, the midpoint of each class stands for values, so each squared deviation is counted times. The number of values is :
لە ، ی هەر نوێنەری نرخە، بۆیە هەر دووجایەکی جار هەژمار دەکرێت. ژمارەی نرخەکان ـە:
Population: divide by . Sample: divide by . The standard deviations are the square roots.
: دابەشی بکە. : دابەشی بکە. ئەمانەن.
H.W 1: population and sample from one tableئەرکی ماڵەوەی 1: کۆمەڵگە و نموونە لە یەک خشتەوە
H.W 1 asks for the variance and S.D. of Table (6), once as a population and once as a sample. Classes 0–5, 5–10, 10–15, 15–20, 20–25 with frequencies 2, 7, 12, 6, 3.
ئەرکی ماڵەوەی 1 داوای و خشتەی (6) دەکات، جارێک وەک و جارێک وەک . 0–5، 5–10، 10–15، 15–20، 20–25 بە 2، 7، 12، 6، 3.
| Class | ||||||
|---|---|---|---|---|---|---|
| 0–5 | 2 | 2.5 | 5 | 103.3611 | 206.7222 | |
| 5–10 | 7 | 7.5 | 52.5 | 26.6944 | 186.8611 | |
| 10–15 | 12 | 12.5 | 150 | 0.0278 | 0.3333 | |
| 15–20 | 6 | 17.5 | 105 | 4.8333 | 23.3611 | 140.1667 |
| 20–25 | 3 | 22.5 | 67.5 | 9.8333 | 96.6944 | 290.0833 |
| Σ | 30 | 380 | 824.1667 |
Check with the shortcut: and ✓.
پشکنین بە ڕێگا کورتەکە: و ✓.
What the standard deviation tells youلادانی پێوانەیی چیت پێ دەڵێت
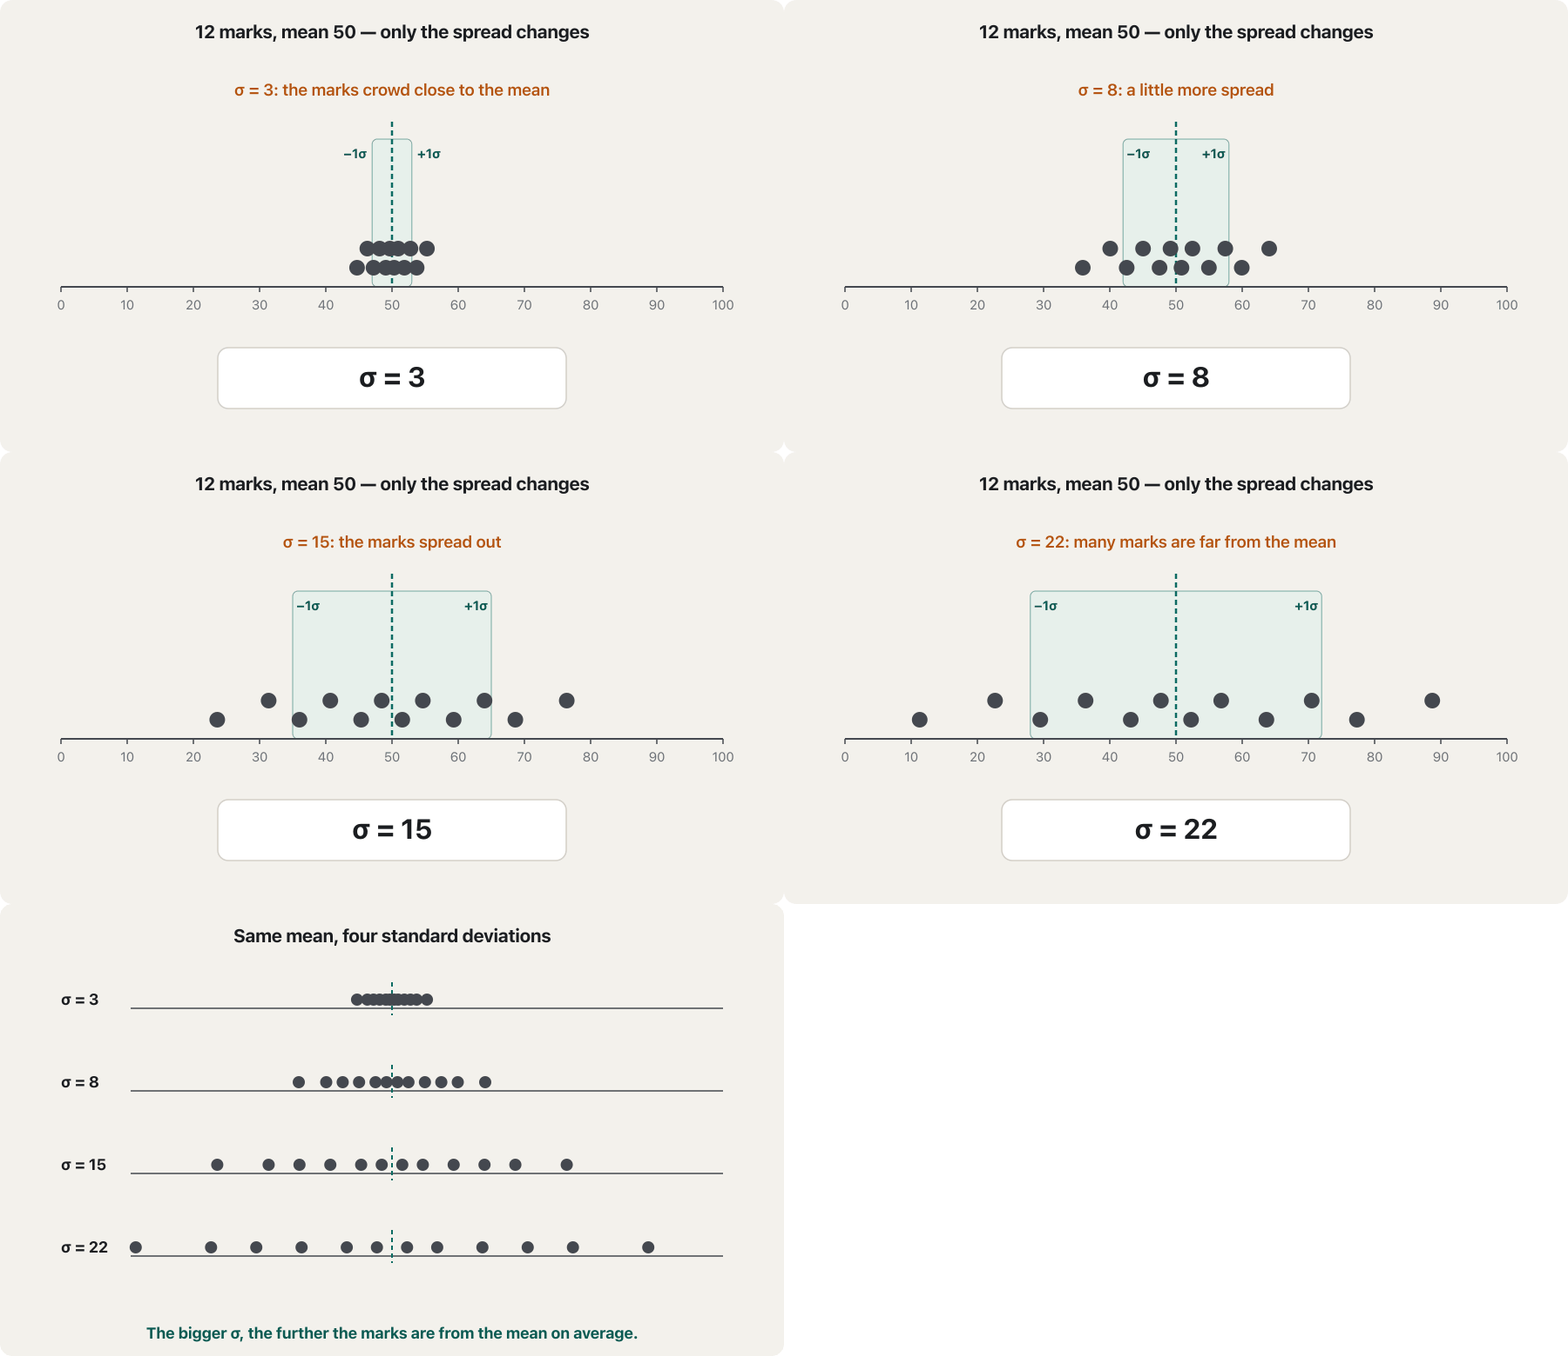
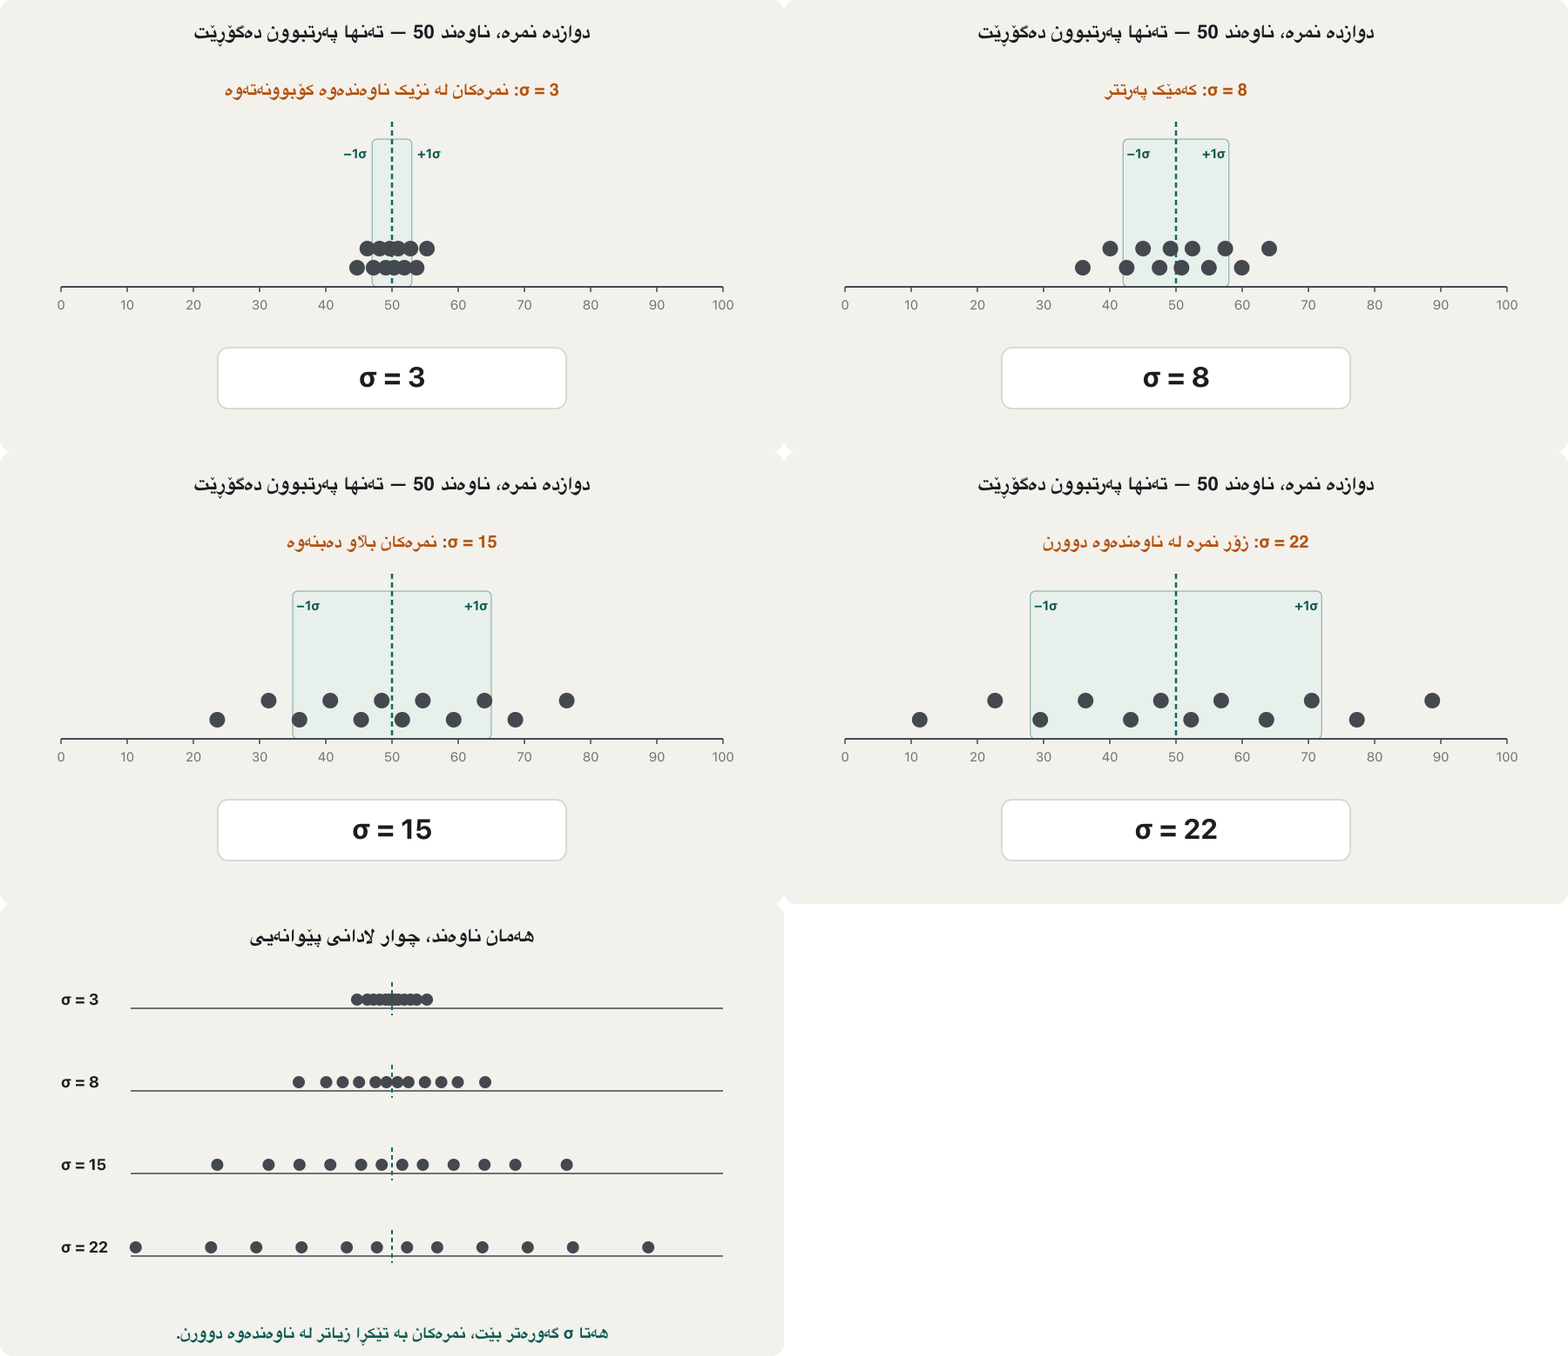
Think of the standard deviation as the typical distance of a value from the mean, in the units of the data. Small : the values crowd around the mean. Large : they are spread far.
وەک دووریی ئاسایی نرخێک لە بیر لێ بکەرەوە، بە یەکەی . ـی بچووک: نرخەکان لە دەوری کۆدەبنەوە. ـی گەورە: زۆر بڵاو دەبنەوە.
How unusual is one value?نرخێک چەند نائاساییە؟
The two classes of the previous lesson have (A) and (B), as populations. The standard deviation also lets you compare single values: a mark of 74 in class A is standard deviations above the mean, while 88 in class B is only . The 74 is the more unusual mark in its class. Counting “how many standard deviations from the mean” is the idea of the z-score: z-scores.
دوو پۆلەکەی وانەی پێشوو، وەک : پۆلی A و پۆلی B . ڕێگە دەدات نرخە تاکەکانیش بەراورد بکەیت: نمرەی 74 لە پۆلی A لە سەرووی ، لە کاتێکدا 88 لە پۆلی B تەنها ـە. 74 لە پۆلەکەی خۆیدا نمرەیەکی نائاساییترە. ژماردنی «چەند لە » بیرۆکەی : نمرە پێوانەییەکان.
Standard deviation vs varianceلادانی پێوانەیی بەرامبەر لێکنەچوون
| Standard deviation | Variance |
|---|---|
| The square root of the variance | The mean of the squared deviations دووجای |
| In the same units as the data (cm, marks, minutes)بە هەمان یەکەی (سم، نمرە، خولەک) | In squared units (cm², marks², minutes²)بە یەکەی دووجا (سم²، نمرە²، خولەک²) |
| Useful to describe a population or a sample and to spot outliersبەسوودە بۆ وەسفکردنی یان و دۆزینەوەی | Useful inside statistical formulas and in finance (risk)بەسوودە لە ناو فۆرمولە ئامارییەکان و لە دارایی (مەترسی) |
- Both are measures of the dispersion of data.
- Both show how much the values vary from the average.
- Both are never negative.
- هەردووکیان پێوەری .
- هەردووکیان نیشان دەدەن نرخەکان چەند لە جیاوازن.
- هەردووکیان هەرگیز نەرێنی نین.
The standard deviation is never negativeلادانی پێوانەیی هەرگیز نەرێنی نییە
- Property 1. Always , and only when all values are equal (every ).
- تایبەتمەندیی 1. هەمیشە و تەنها کاتێک هەموو نرخەکان یەکسانن (هەموو ).
Why? Every squared deviation is 0 or more, so their mean is 0 or more, and the square root of that is 0 or more. It is 0 only when every deviation is 0, that is, when there is no spread at all.
بۆچی؟ هەموو دووجایەکی 0 یان زیاترە، بۆیە تێکڕاکەیان 0 یان زیاترە و ئەویش 0 یان زیاترە. تەنها کاتێک 0ـە کە هەموو 0 بێت، واتە هیچ نەبێت.
Properties: adding and multiplyingتایبەتمەندییەکان: زیادکردن و لێکدان
- Property 2. If then and ; the S.D. is multiplied by .
- Property 3. If then and : adding a constant changes nothing.
- تایبەتمەندیی 2. ئەگەر ئەوا و ؛ S.D لە لێک دەدرێت.
- تایبەتمەندیی 3. ئەگەر ئەوا و : زیادکردنی هیچ ناگۆڕێت.
Check with Example 5 (): adding 10 to every value gives 19, 18, 16, 15, 17, still . Doubling gives 18, 16, 12, 10, 14 with and . The same rules hold for a random variable: Rules for the variance.
بە نموونەی 5 بیپشکنە (): زیادکردنی 10 بۆ هەموو نرخێک 19، 18، 16، 15، 17 دەدات، هێشتا . دوو هێندەکردن 18، 16، 12، 10، 14 دەدات بە و . هەمان یاسا بۆ ڕاستن: یاساکانی لێکنەچوون.
If the teacher adds 5 bonus marks to every student, everybody moves up together: the mean rises by 5 but the gaps between students stay the same, so does not change. If the teacher doubles every mark, every gap doubles too, so doubles.
ئەگەر مامۆستا 5 نمرەی زیادە بداتە هەموو قوتابییەک، هەموو پێکەوە بەرز دەبنەوە: 5 بەرز دەبێتەوە بەڵام بۆشاییەکانی نێوان قوتابییان وەک خۆیان دەمێننەوە، بۆیە ناگۆڕێت. ئەگەر مامۆستا هەموو نمرەیەک دوو هێندە بکات، هەموو بۆشاییەکیش دوو هێندە دەبێت، بۆیە دوو هێندە دەبێت.
Where the analogy stops workingسنووری ئەم نموونەیە
Real marks have a ceiling (100); bonus marks that push some students past it would squeeze the top and change .
نمرەی ڕاستەقینە سەقفی هەیە (100)؛ ئەگەر نمرەی زیادە هەندێک قوتابی تێپەڕێنێت، سەرەوە دەپەستێت و دەگۆڕێت.
Variance in Pythonلێکنەچوون لە Pythonـدا
Python's statistics module has both versions. The names are easy to mix up: the one with a p (population) divides by N; the one without divides by .
statistics لە Python هەردوو وەشانەکەی هەیە. ناوەکان ئاسان تێکەڵ دەبن: ئەوەی p ـی هەیە (population) دابەشی N دەکات؛ ئەوەی نییەتی دابەشی دەکات.
import statistics

sample = [9, 8, 6, 5, 7]                      # Example 5
print(statistics.variance(sample))           # s²: divides by n - 1
print(statistics.stdev(sample))              # s
print(statistics.pvariance(sample))          # σ²: divides by N
print(statistics.pstdev(sample))             # σ

# H.W 1: repeat every midpoint F times, then use the same functions
F = [2, 7, 12, 6, 3]
X = [2.5, 7.5, 12.5, 17.5, 22.5]
data = [x for f, x in zip(F, X) for _ in range(f)]
print(len(data), round(statistics.pvariance(data), 3), round(statistics.variance(data), 3))
print(round(statistics.pstdev(data), 3), round(statistics.stdev(data), 3))2.5 1.5811388300841898 2 1.4142135623730951 30 27.472 28.42 5.241 5.331
Explain the codeڕوونکردنەوەی کۆدەکە
- Lineدێڕی 4-7
Example 5: variance → 2.5 and stdev → 1.581 (sample); pvariance → 2 and pstdev → 1.414 (population).
نموونەی 5:
variance← 2.5 وstdev← 1.581 ()؛pvariance← 2 وpstdev← 1.414 ().- Lineدێڕی 12
A frequency table becomes a list by repeating each midpoint F times.
دەبێتە بە دووبارەکردنەوەی هەر F جار.
- Lineدێڕی 13-14
H.W 1 again: 27.472 and 28.42, 5.241 and 5.331.
دیسان ئەرکی ماڵەوەی 1: 27.472 و 28.42، 5.241 و 5.331.
Common mistakesهەڵە باوەکان
| Mistakeهەڵە | Why it is wrongبۆچی هەڵەیە | Correctدروست |
|---|---|---|
| Dividing a sample by nدابەشکردنی بە n | Too small on averageبە تێکڕا زۆر بچووکە | Sample: ; population: N: ؛ : N |
| Forgetting F in لەبیرکردنی F لە | Each midpoint stands for F valuesهەر نوێنەری F نرخە | Multiply each square by Fهەر دووجایەک لە F لێک بدە |
| written as وەک نووسراوە | It reads as a different sumوەک کۆیەکی تر دەخوێندرێتەوە | |
| Squaring the sum instead of summing squaresدووجاکردنی کۆ لە جیاتی کۆکردنەوەی دووجاکان | is always 0 هەمیشە 0ـە | Square first, then addسەرەتا دووجا بکە، پاشان کۆ بکەرەوە |
| Reporting the variance as the S.D.ڕاگەیاندنی وەک S.D | Wrong units (cm² instead of cm)یەکەی هەڵە (سم² لە جیاتی سم) | Take the square root وەربگرە |
| Rounding the mean too early زوو | Every deviation inherits the errorهەموو هەڵەکە وەردەگرێت | Keep 4 decimals, or use the shortcut4 بهێڵەرەوە، یان ڕێگا کورتەکە بەکاربهێنە |
| Mixing up variance and pvariance in Pythonتێکەڵکردنی variance و pvariance لە Python | They use different divisorsدابەشکەری جیاوازیان هەیە | p = population (divide by N)p واتە (دابەشکردن بە N) |
Exercisesڕاهێنانەکان
Use the Group B frequency table from the practice lesson (midpoints 9.5, 21.5, …, 81.5; frequencies 4, 8, 14, 8, 8, 4, 4; , ). Find , , and s.
گرووپی B لە وانەی ڕاهێنان بەکاربهێنە ( 9.5، 21.5، …، 81.5؛ 4، 8، 14، 8، 8، 4، 4؛ ، ). ، ، و s بدۆزەرەوە.
Hintئاماژە
Use the shortcut .
ڕێگا کورتەکە بەکاربهێنە: .
Show answerوەڵامەکە پیشان بدە
import statistics

F = [4, 8, 14, 8, 8, 4, 4]                       # Group B frequency table
X = [9.5, 21.5, 33.5, 45.5, 57.5, 69.5, 81.5]    # class midpoints
data = [x for f, x in zip(F, X) for _ in range(f)]

print("population:", round(statistics.pvariance(data), 2), round(statistics.pstdev(data), 2))
print("sample: ", round(statistics.variance(data), 2), round(statistics.stdev(data), 2))population: 397.67 19.94 sample: 405.79 20.14
Suppose classes A (66, 68, 69, 70, 70, 71, 72, 74) and B (45, 52, 60, 70, 75, 82, 88, 88) were random samples from two large schools. Find s for each.
وا دابنێ پۆلەکانی A (66، 68، 69، 70، 70، 71، 72، 74) و B (45، 52، 60، 70، 75، 82، 88، 88) لە دوو قوتابخانەی گەورە. s بۆ هەریەکەیان بدۆزەرەوە.
Show answerوەڵامەکە پیشان بدە
Sums of squared deviations: A: ; B: . Divide by : , (as populations: 2.29 and 15.27).
کۆی دووجای : A: ؛ B: . دابەشی بکە: ، (وەک : 2.29 و 15.27).
Example 5 has . Every value is multiplied by 10 and then 5 is added (, , …). Without recomputing, what are the new S and ?
نموونەی 5 ی هەیە. هەموو نرخێک لە 10 لێک دەدرێت و پاشان 5ی بۆ زیاد دەکرێت (، ، …). بەبێ دووبارە ژماردنەوە، S و ـی نوێ چەندن؟
Show answerوەڵامەکە پیشان بدە
Property 3 with , : adding 5 changes nothing, multiplying by 10 multiplies S by 10: and .
تایبەتمەندیی 3 بە ، : زیادکردنی 5 هیچ ناگۆڕێت و لێکدان لە 10، S لە 10 لێک دەدات: و .
The sample mean divides by n, but the sample variance by . Explain the difference in two sentences.
دابەشی n دەکات، بەڵام دابەشی . جیاوازییەکە بە دوو ڕستە ڕوون بکەرەوە.
Show answerوەڵامەکە پیشان بدە
The mean does not use any estimated quantity, so on average already equals . The variance measures deviations from , which was estimated from the same values and hugs them; dividing by makes up for that.
هیچ بڕێکی خەمڵێنراو بەکار ناهێنێت، بۆیە بە تێکڕا خۆی یەکسانە بە . لە دەپێوێت کە لە هەمان نرخەکانەوە خەمڵێنراوە و لێیان نزیکە؛ دابەشکردن بە قەرەبووی ئەوە دەکاتەوە.
Summaryپوختە
- Variance = mean of the squared deviations; standard deviation = its square root (in the data's units).
- Population: . Sample: .
- Why : a sample is closer to its own mean than to the true mean; dividing by n would be too small by on average (Bessel's correction, degrees of freedom).
- Grouped: , .
- Properties: ; adding a constant changes nothing; multiplying by k multiplies S by and by .
- Results: Example 5 , ; H.W 1 , , , .
- = دووجای ؛ = (بە یەکەی ).
- : . : .
- بۆچی : لە خۆی نزیکترە تا لە ڕاستەقینە؛ دابەشکردن بە n بە تێکڕا بە ڕێژەی بچووک دەبێت (، ).
- پۆلێنکراو: ، .
- تایبەتمەندییەکان: ؛ زیادکردنی هیچ ناگۆڕێت؛ لێکدان لە k، S لە و لە لێک دەدات.
- ئەنجامەکان: نموونەی 5، ، ؛ ئەرکی ماڵەوەی 1، ، ، ، .
What is the variance of 4, 4, 4, 4?لێکنەچوونی 4، 4، 4، 4 چەندە؟
0: all values equal the mean, so there is no spread.
0: هەموو نرخەکان یەکسانن بە ، بۆیە هیچ نییە.
Why report the S.D. rather than the variance?بۆچی S.D ڕادەگەیەنین نەک لێکنەچوون؟
The S.D. is in the data's units; the variance is in squared units.
S.D بە یەکەی ؛ بە یەکەی دووجا.
Which Python function divides by N?کام کرداری Python دابەشی N دەکات؟
statistics.pvariance (and pstdev).
statistics.pvariance (و pstdev).
Videoڤیدیۆ
Watch a videoسەیری ڤیدیۆیەک بکە
A video that viewers liked a lot and praised in their comments, chosen for this lesson.ڤیدیۆیەک کە بینەران زۆریان پێ خۆش بووە و لە کۆمێنتەکانیاندا ستایشیان کردووە، بۆ ئەم وانەیە هەڵبژێردراوە.
Population mean, variance and standard deviation, and how a sample estimates them — dividing by n − 1 for the sample variance.
، و لە ، هەروەها چۆن مەزەندەیان دەکات: بۆ دابەش بە دەکەین.
Whole video: population formulas vs sample estimates (n − 1)
هەموو ڤیدیۆکە: بەرامبەر مەزەندەکانی ().
Lesson complete!وانەکە تەواو بوو!
Well done. Review the key terms, then go on to the next lesson.دەستخۆش. سەیرێکی زاراوە سەرەکییەکان بکەرەوە، پاشان بڕۆ بۆ وانەی داهاتوو.
Key termsزاراوە سەرەکییەکان
Coefficient of Variation and Momentsهاوکۆلکەی گۆڕان و مۆمێنتەکان
Related lecturesوانە پەیوەندیدارەکان
- Coefficient of Variation and Momentsهاوکۆلکەی گۆڕان و مۆمێنتەکان
- What Is Statistics? Data, Populations and Samplesئامار چییە؟ دراوە، کۆمەڵگە و نموونە
- Practice: One Data Set from Table to Averagesڕاهێنان: یەک کۆمەڵەدراوە لە خشتەوە بۆ پێوەرەکانی ڕووکردنە چەق
- Quartiles, Percentiles and Box Plots (Supplementary)چواریەکەکان، سەدیەکەکان و هێڵکارییە سندووقییەکان (زیادە)
- The Normal Distribution (Supplementary)دابەشبوونی ئاسایی (زیادە)
- Moments, Variance and Standard Deviation of a Random Variableمۆمێنتەکان، لێکنەچوون و لادانی پێوانەیی گۆڕاوێکی هەڕەمەکی
References and further readingسەرچاوەکان و خوێندنەوەی زیاتر
This lecture is a first edition. The Kurdish text and terminology are waiting for review by Kurdish IT teachers.ئەم وانەیە چاپی یەکەمە. دەقە کوردییەکە و زاراوەکانی چاوەڕێی پێداچوونەوەی مامۆستایانی کوردی بواری IT ن.