Chapterبەش 3 · Lectureوانە 3.1
Measuring Spread: Range and Mean Deviationپێوانی پەرتبوون: مەودا و لادانی نێوانەیی
Why an average is not enough; the range of raw and grouped data and its weakness with outliers; deviations and why they sum to zero; the mean deviation about the mean, median and mode, for raw and grouped data — with the course's Examples 1–4 (Example 4 corrected to ).
بۆچی ناوەند بەس نییە؛ خاو و پۆلێنکراو و لاوازییەکەی لە بەرامبەر ؛ و بۆچی کۆیان سفرە؛ دەربارەی ، و ، بۆ خاو و پۆلێنکراو — لەگەڵ نموونەکانی 1–4ی کۆرسەکە (نموونەی 4 ڕاستکراوەتەوە بۆ ).
What you will learnچی فێر دەبیت
- Explain why a measure of spread is needed next to an average.
- Find the range of raw and grouped data and say why one outlier can mislead it.
- Explain why the plain deviations from the mean cannot measure spread (they always add up to zero).
- Compute the mean deviation about the mean, median and mode, for raw and grouped data.
- ڕوونی بکەیتەوە بۆچی لە تەنیشت ناوەندێکدا پێوەرێکی پێویستە.
- خاو و پۆلێنکراو بدۆزیتەوە و بڵێیت بۆچی یەک دەتوانێت هەڵەی پێ بکات.
- ڕوونی بکەیتەوە بۆچی لە بە تەنها ناتوانن بپێون (کۆیان هەمیشە سفرە).
- دەربارەی ، و بۆ خاو و پۆلێنکراو بژمێریت.
Same average, different storyهەمان ناوەند، چیرۆکی جیاواز
Chapter Three of the course is about measures of dispersion or variation. An average tells you where the centre of the data is. It does not tell you how far the values wander from that centre. Look at the marks of two classes, eight students each:
بەشی سێیەمی کۆرسەکە دەربارەی پێوەرەکانی یان گۆڕانە. ناوەندێک پێت دەڵێت چەقی لە کوێیە. بەڵام پێت ناڵێت نرخەکان چەند لەو چەقە دوور دەکەونەوە. سەیری نمرەی دوو پۆل بکە، هەریەکەیان هەشت قوتابی:
| Classپۆل | Marksنمرەکان | Mean |
|---|---|---|
| A | 66, 68, 69, 70, 70, 71, 72, 7466، 68، 69، 70، 70، 71، 72، 74 | 70 |
| B | 45, 52, 60, 70, 75, 82, 88, 8845، 52، 60، 70، 75، 82، 88، 88 | 70 |
The mean alone says the classes are the same. They are not: in class A every student is close to 70, in class B some students are struggling and some are excellent. A measure of dispersion is one number that describes this spread. This chapter builds four of them: the range and the mean deviation (this lesson), then the variance and the standard deviation.
تەنها دەڵێت دوو پۆلەکە وەک یەکن. وا نییە: لە پۆلی A هەموو قوتابییەک نزیکی 70ـە، لە پۆلی B هەندێک قوتابی لە زەحمەتیدان و هەندێکیان زۆر باشن. پێوەری یەک ژمارەیە کە ئەم وەسف دەکات. ئەم بەشە چواریان دروست دەکات: و (ئەم وانەیە)، پاشان و .
How spread out the data is. Measures of dispersion include the , , and .
ئەوەیە کە دراوەکە چەند پەرت و بڵاوە. پێوەرەکانی پەرتبوون و و و دەگرنەوە.
Spread in daily lifeپەرتبوون لە ژیانی ڕۆژانەدا
Two minibus drivers on the Sulaimani–Erbil road both need 2 hours on average. The first one always arrives between 1 h 55 min and 2 h 05 min. The second one sometimes takes 1 h 30 min and sometimes 3 hours. If you have an exam at 10:00, you choose the first driver: same average, much smaller spread.
دوو شۆفێری پاس لە ڕێگای سلێمانی–هەولێر هەردووکیان بە تێکڕا 2 کاتژمێریان پێویستە. یەکەمیان هەمیشە لە نێوان 1 کاتژمێر و 55 خولەک و 2 کاتژمێر و 5 خولەکدا دەگات. دووەمیان هەندێک جار 1 کاتژمێر و نیو و هەندێک جار 3 کاتژمێر دەخایەنێت. ئەگەر کاتژمێر 10:00 تاقیکردنەوەت هەبێت، شۆفێری یەکەم هەڵدەبژێریت: هەمان تێکڕا، زۆر کەمتر.
Where the analogy stops workingسنووری ئەم نموونەیە
Real trip times are not symmetric: a traffic jam can add an hour, but nothing can save an hour. Spread measures still work, but one number cannot show that shape.
کاتی ڕاستەقینەی گەشت هاوجێ نییە: قەرەباڵغییەک دەتوانێت کاتژمێرێک زیاد بکات، بەڵام هیچ شتێک کاتژمێرێک کەم ناکاتەوە. پێوەرەکانی هەر کار دەکەن، بەڵام یەک ژمارە ناتوانێت ئەو شێوەیە نیشان بدات.
The range: largest minus smallestمەودا: گەورەترین کەم بچووکترین
The simplest measure of spread is the range: the distance between the largest and the smallest value.
سادەترین پێوەری : دووریی نێوان گەورەترین و بچووکترین نرخ.
The largest value minus the smallest value. It is the simplest measure of , but it uses only two values.
گەورەترین نرخ لە بچووکترین نرخ کەم دەکرێتەوە. سادەترین پێوەری ، بەڵام تەنها دوو نرخ بەکار دەهێنێت.
R is the range, the largest value and the smallest value of ungrouped data.
R ، گەورەترین نرخ و بچووکترین نرخی .
- Example 1نموونەی 1
Values 15, 20, 25, 25, 30, 35: .
نرخەکانی 15، 20، 25، 25، 30، 35: .
- The two classesدوو پۆلەکە
Class A: . Class B: . The range already shows that class B is much more spread out.
پۆلی A: . پۆلی B: . هەر ئێستا نیشان دەدات کە پۆلی B زۆر پەرتترە.
The range has the same unit as the data (marks, cm, minutes). In Python it is simply max(data) - min(data). You have used it before as the total range T.R, step 1 of building a frequency table.
هەمان یەکەی هەیە (نمرە، سم، خولەک). لە Pythonـدا تەنها max(data) - min(data)ـە. پێشتر وەک T.R بەکارت هێناوە، هەنگاوی 1ی دروستکردنی خشتەیەکی دووبارەبوونەوە.
How to find the range (largest minus smallest), and why the range alone can mislead because it uses only two values.
چۆن دەدۆزیتەوە (گەورەترین نرخ کەم بچووکترین نرخ)، هەروەها بۆچی بە تەنها دەکرێت چەواشەکار بێت، چونکە تەنها دوو نرخ بەکار دەهێنێت.
Watch 2:14–4:27: the range, an example, and why two values are not enough
لە 2:14 تا 4:27 سەیر بکە: ، نموونەیەک و بۆچی دوو نرخ بەس نییە.
The range of grouped dataمەودای دراوەی پۆلێنکراو
In a frequency table we no longer see the single values. So the range is taken from the classes: the upper limit of the last class minus the lower limit of the first class.
لە چیتر نرخە تاکەکان نابینین. بۆیە لە وەردەگیرێت: سەرەوەی دوایین کەم خوارەوەی یەکەم .
| Class | 5–10 | 10–15 | 15–20 | 20–25 |
|---|---|---|---|---|
| Frequency | 5 | 4 | 1 | 2 |
The range R: upper limit of the last class (25) minus lower limit of the first class (5).
R: سەرەوەی دوایین (25) کەم خوارەوەی یەکەم (5).
Why the range is not enoughبۆچی مەودا بەس نییە
The range looks at only two values and ignores everything in between. That causes two problems.
تەنها سەیری دوو نرخ دەکات و هەموو ئەوانەی نێوانیان پشتگوێ دەخات. ئەمە دوو کێشە دروست دەکات.
- One extreme value changes it completely. Add one student with 20 marks to class A: the range jumps from 8 to , although the other eight marks are still crowded around 70. Such a far-away value is called an outlier.
- Different spreads can have the same range. C (50, 70, 70, 70, 70, 70, 70, 90) and D (50, 55, 60, 65, 75, 80, 85, 90) both have mean 70 and range 40. But in C six values sit exactly on the mean, in D the values are spread evenly.
- یەک نرخی دوور بە تەواوی دەیگۆڕێت. قوتابییەک بە نمرەی 20 بخەرە پۆلی A: لە 8ـەوە بازدەدات بۆ ، هەرچەندە هەشت نمرەکەی تر هێشتا لە دەوری 70 کۆبوونەتەوە. نرخێکی ئاوا دوور پێی دەوترێت .
- جیاواز دەکرێت هەمان هەبێت. C (50، 70، 70، 70، 70، 70، 70، 90) و D (50، 55، 60، 65، 75، 80، 85، 90) هەردووکیان 70 و 40یان هەیە. بەڵام لە C شەش نرخ ڕێک لەسەر ، لە D نرخەکان بە یەکسانی بڵاو بوونەتەوە.
So we want a measure that uses every value. The idea: measure how far each value is from the centre, then average these distances. (A sturdier relative of the range, the interquartile range, which ignores the extreme quarters, is taught in Quartiles and box plots.)
کەواتە پێوەرێکمان دەوێت کە هەموو نرخێک بەکاربهێنێت. بیرۆکەکە: بپێوە هەر نرخێک چەند لە چەقەوە دوورە، پاشان تێکڕای ئەم دوورییانە وەربگرە. (، خزمێکی بەهێزتری کە چارەکە دوورەکان پشتگوێ دەخات، لە چواریەکەکان و هێڵکارییە سندووقییەکان دەخوێندرێت.)
A value far away from the rest of the data. A common rule: below or above .
نرخێکە کە زۆر دوورە لە باقیی دراوەکە. یاسایەکی باو: کەمتر لە یان زیاتر لە .
Deviations, and why they add up to zeroلادانەکان و بۆچی کۆیان سفرە
The deviation of a value is how far it is from the mean, with a sign: . Values above the mean have positive deviations, values below have negative ones.
نرخێک ئەوەیە کە چەند لە دوورە، لەگەڵ نیشانەکەی: . نرخەکانی سەرووی ئەرێنییان هەیە و ئەوانەی خوارەوە نەرێنی.
How far a value is from a centre such as the : . Deviations from the mean always add up to 0.
دووریی نرخێکە لە ناوەندێک وەک : . کۆی لادانەکان لە هەمیشە دەکاتە 0.
Class A (mean 70) has the deviations . Add them: 0. This is not luck: the deviations from the mean always add up to 0, because the mean is the balance point of the data (the reason is shown in The deviations always add up to zero).
پۆلی A ( 70) ئەمانەن: . کۆیان بکەرەوە: 0. ئەمە بەخت نییە: کۆی لە هەمیشە 0ـە، چونکە خاڵی هاوسەنگیی (هۆکارەکەی لە کۆی لادانەکان هەمیشە سفرە ڕوون کراوەتەوە).
So the plain average of the deviations is always 0 and tells us nothing about spread. We must get rid of the signs. There are two ways: take absolute values (this lesson, the mean deviation) or take squares (the next lesson, the variance).
کەواتە تێکڕای سادەی هەمیشە 0ـە و هیچ دەربارەی پێمان ناڵێت. دەبێت نیشانەکان لاببەین. دوو ڕێگا هەیە: وەربگرین (ئەم وانەیە، ) یان دووجا بکەین (وانەی داهاتوو، ).
Mean deviation (M.D)لادانی نێوانەیی (M.D)
The mean deviation (M.D) is the mean of the absolute deviations from a centre A. The absolute value of a number is the number without its sign, written between two vertical lines: , . (More in Absolute value.)
(M.D) لە چەقێکی A. ژمارەیەک خودی ژمارەکەیە بەبێ نیشانەکەی و لە نێوان دوو هێڵی ستوونیدا دەنووسرێت: ، . (زیاتر لە نرخی ڕووت.)
The mean of the absolute from a centre (usually the ): .
نرخە ڕووتەکانی لە ناوەندێک (زۆرجار ): .
The centre A is usually the mean, but the median or the mode can be used too.
چەقی A زۆرجار ، بەڵام دەکرێت یان بەکاربهێنرێت.
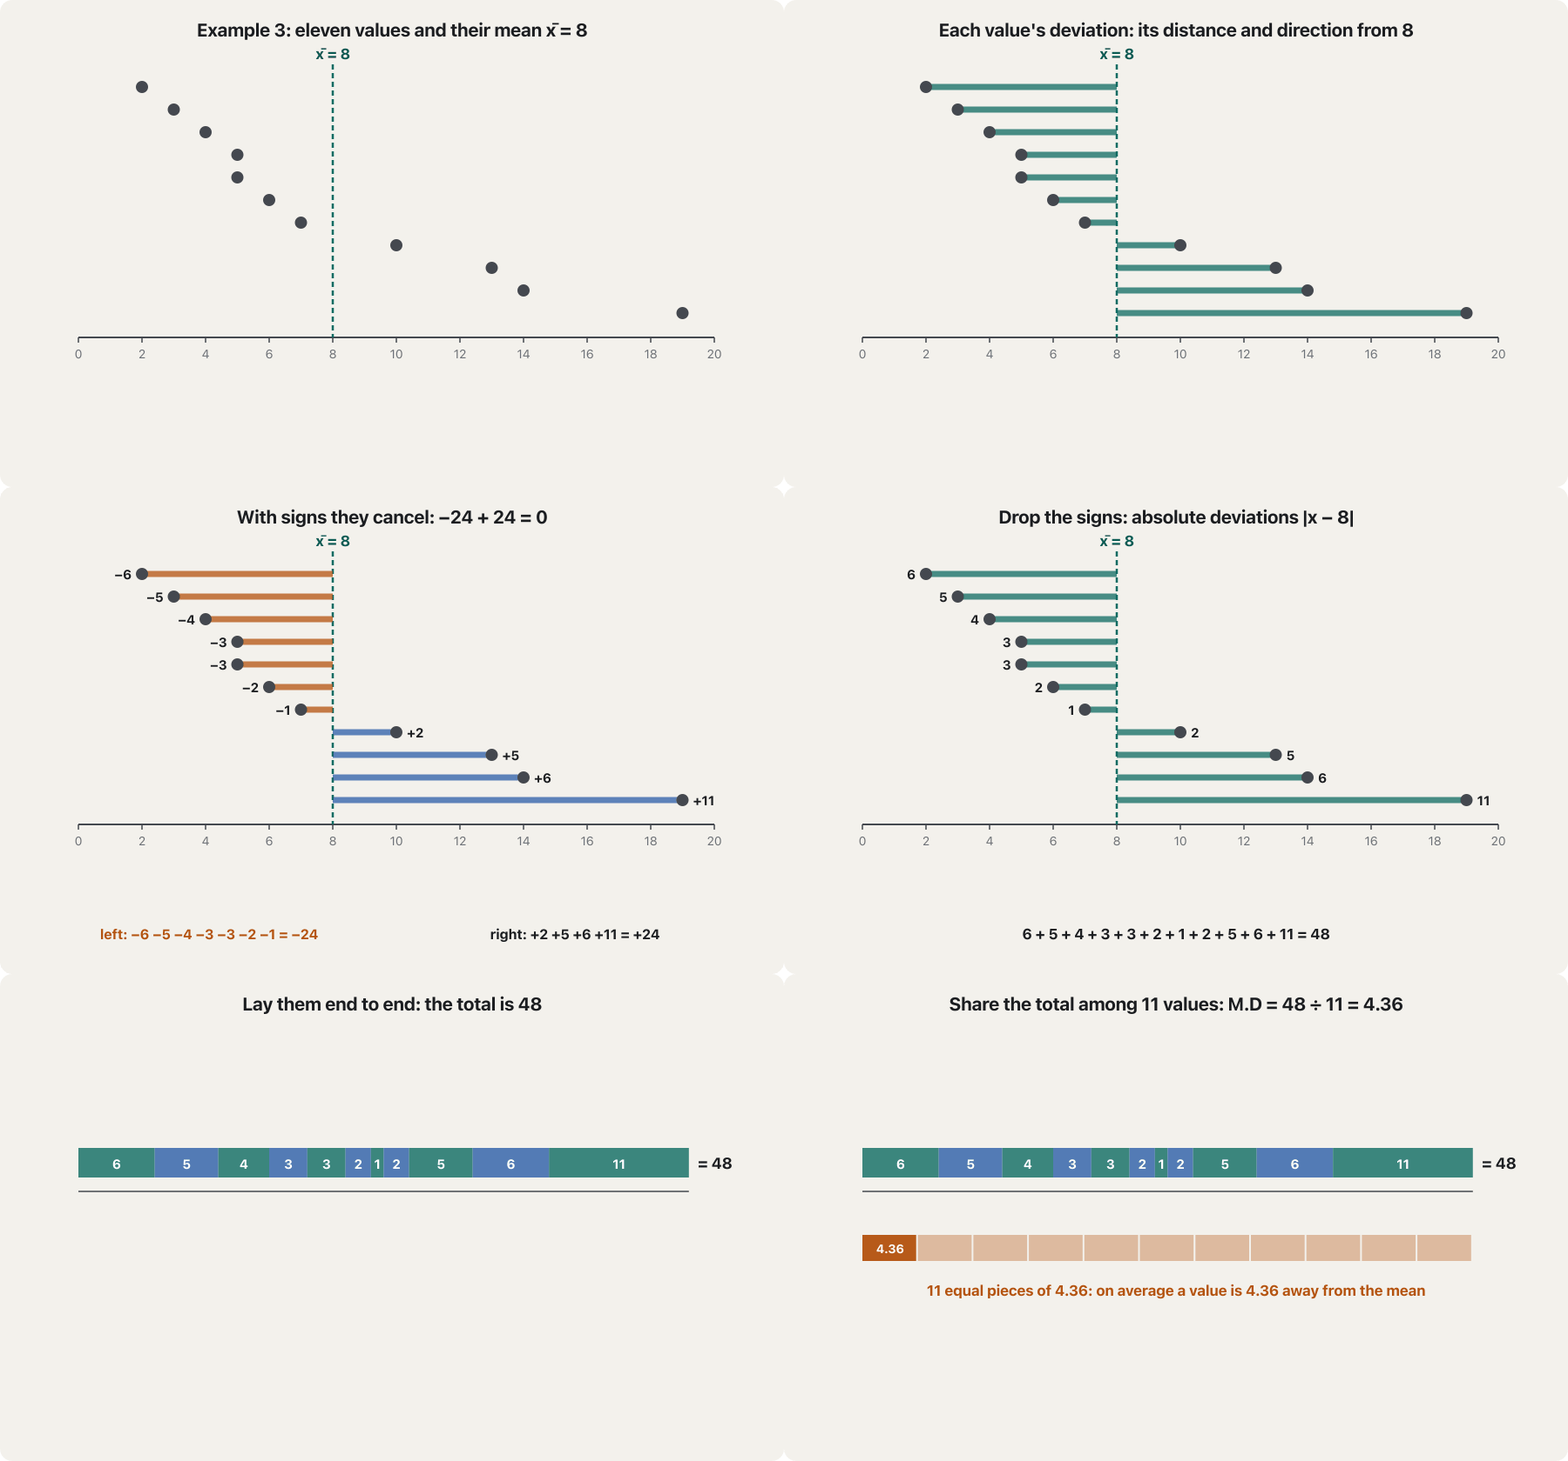
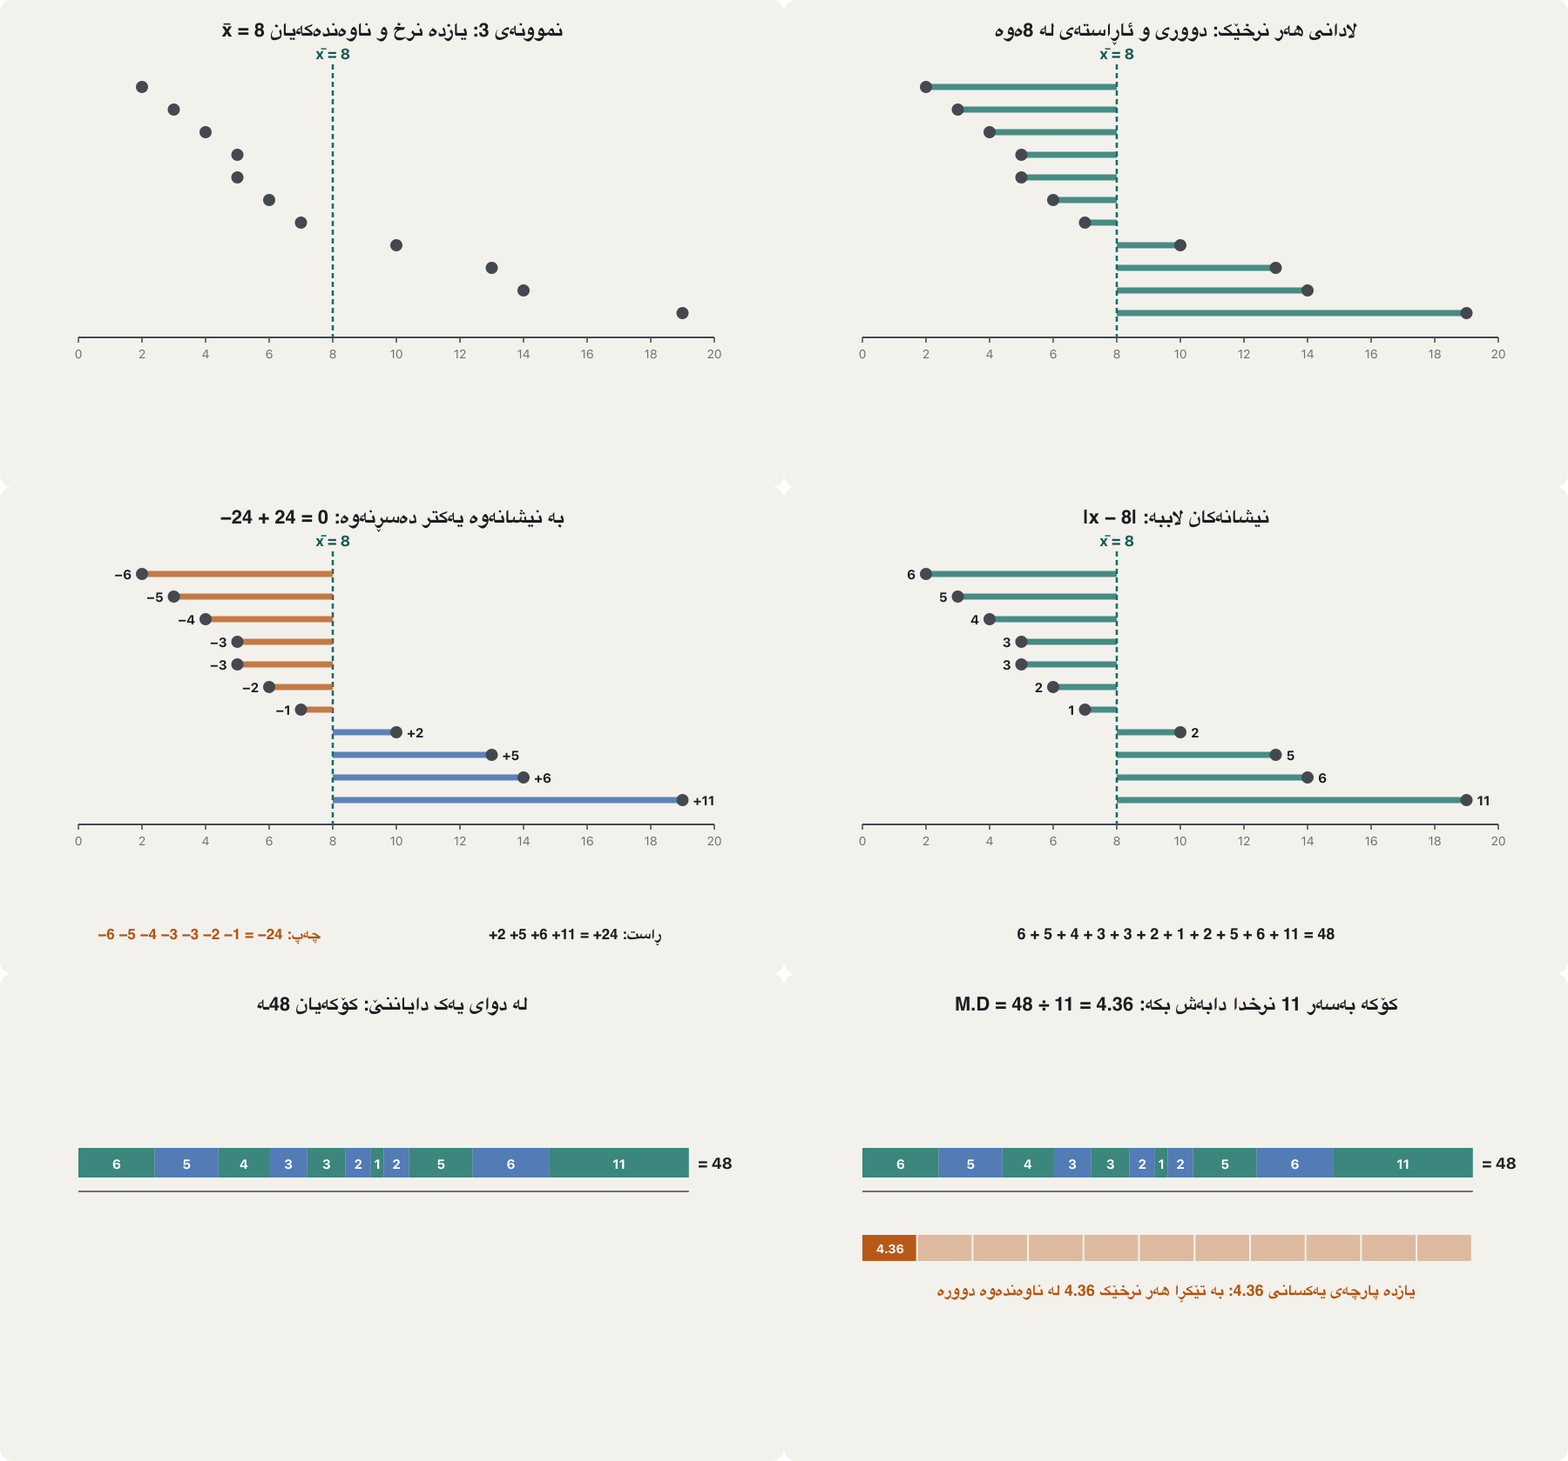
Example 3: M.D about the meanنموونەی 3: M.D دەربارەی ناوەند
Find the mean deviation of 2, 3, 4, 5, 5, 6, 7, 10, 13, 14, 19. First the mean: .
بۆ 2، 3، 4، 5، 5، 6، 7، 10، 13، 14، 19 بدۆزەرەوە. سەرەتا : .
| 2 | 3 | 4 | 5 | 5 | 6 | 7 | 10 | 13 | 14 | 19 | |
|---|---|---|---|---|---|---|---|---|---|---|---|
| 6 | 5 | 4 | 3 | 3 | 2 | 1 | 2 | 5 | 6 | 11 |
M.D about the median and the modeM.D دەربارەی ناوەڕاستە و باو
The notes leave M.D about the median and the mode of Example 3 as homework. The median of the 11 ordered values is the 6th one, 6; the mode is 5 (it appears twice).
تێبینییەکان M.D دەربارەی و نموونەی 3 وەک ئەرکی ماڵەوە بەجێ دەهێڵن. 11 نرخە ڕیزکراوەکە شەشەمیانە، 6؛ 5ـە (دوو جار دێت).
| Centre Aچەقی A | M.D | |
|---|---|---|
| mean 8 8 | 48 | |
| median 6 6 | ||
| mode 5 5 |
The median gives the smallest mean deviation. This is always true for raw data: the median is the point with the least total distance to all values. Move the centre one step to the right of the median and more values get further away than get closer.
بچووکترین دەدات. ئەمە بۆ نرخی خاو هەمیشە ڕاستە: ئەو خاڵەیە کە کەمترین کۆی دووریی هەیە لە هەموو نرخەکانەوە. ئەگەر چەقەکە یەک هەنگاو بەرەو ڕاستی ببەیت، ژمارەی ئەو نرخانەی دوورتر دەکەونەوە زیاترە لەوانەی نزیکتر دەبنەوە.
Why the median wins: the meeting pointبۆچی ناوەڕاستە دەباتەوە: شوێنی یەکتربینین
Five friends live along one long street, at houses number 2, 3, 10, 11 and 30. They want to meet in a tea house on the street so that their total walk is as short as possible. The best place is the middle house, 10 (the median): the total walk is . At the mean, 11.2, it is 37.6.
پێنج هاوڕێ لە درێژایی شەقامێکدا دەژین، لە ماڵەکانی ژمارە 2، 3، 10، 11 و 30. دەیانەوێت لە چایخانەیەکی سەر شەقامەکە یەکتر ببینن بە جۆرێک کە کۆی ڕۆیشتنیان کورتترین بێت. باشترین شوێن ئەو ماڵەیە کە لە ناوەڕاستدایە، 10 (): کۆی ڕۆیشتن دەکاتە . لە ، 11.2، دەکاتە 37.6.
Where the analogy stops workingسنووری ئەم نموونەیە
This works for walking distance, which grows in a straight line. If the cost grows faster for long walks (squared distance), the best place becomes the mean — that is the idea behind the variance.
ئەمە بۆ دووریی ڕۆیشتن ڕاستە کە بە هێڵی ڕاست زیاد دەکات. ئەگەر تێچوون بۆ ڕۆیشتنی درێژ خێراتر زیاد بکات (دووریی دووجاکراو)، باشترین شوێن دەبێتە — ئەمە بیرۆکەی پشتی .
Mean deviation of grouped dataلادانی نێوانەیی بۆ دراوەی پۆلێنکراو
For a frequency table, each class midpoint stands for the values of its class. So each absolute deviation is counted times, and we divide by the number of values :
بۆ ، هەر نوێنەری نرخەکەی . بۆیە هەر جار هەژمار دەکرێت و دابەشی ژمارەی نرخەکان، ، دەکەین:
- Midpoints and the meanخاڵە ناوەڕاستەکانی کلاس و ناوەند
Add the columns and ; .
ستوونەکانی و زیاد بکە؛ .
- Distancesدوورییەکان
Add the column .
ستوونی زیاد بکە.
- Weight themکێشیان پێ بدە
Multiply by the frequencies: , and add the column.
لێکیان بدە لە : . پاشان ستوونەکە کۆ بکەرەوە.
- Divideدابەش بکە
Divide the total by (the number of values, not the number of classes).
کۆکە دابەشی بکە (ژمارەی نرخەکان، نەک ژمارەی ).
Example 4 of the notes: classes 0–10, 10–20, 20–30, 30–40, 40–50 with frequencies 5, 8, 15, 16, 6. Its worked table is on the next screen.
نموونەی 4ی تێبینییەکان: 0–10، 10–20، 20–30، 30–40، 40–50 بە 5، 8، 15، 16، 6. خشتە کارکراوەکەی لە پەڕەی داهاتوودایە.
Mean deviation of grouped dataلادانی نێوانەیی بۆ دراوەی پۆلێنکراو
Example 4, correctedنموونەی 4، ڕاستکراوە
| Class | |||||
|---|---|---|---|---|---|
| 0–10 | 5 | 5 | 25 | 22 | 110 |
| 10–20 | 8 | 15 | 120 | 12 | 96 |
| 20–30 | 15 | 25 | 375 | 2 | 30 |
| 30–40 | 16 | 35 | 560 | 8 | 128 |
| 40–50 | 6 | 45 | 270 | 18 | 108 |
| Σ | 50 | 1350 | 472 |
Range and M.D in Pythonمەودا و M.D لە Pythonـدا
Python's statistics module has no mean-deviation function, but it is one line with abs(). The program checks Example 3 for all three centres:
statistics لە Pythonـدا هیچ بۆ نییە، بەڵام بە abs() یەک دێڕە. بەرنامەکە نموونەی 3 بۆ هەر سێ چەقەکە دەپشکنێت:
import statistics

def mean_deviation(values, centre):
    """Mean of the absolute deviations from a centre."""
    return sum(abs(x - centre) for x in values) / len(values)

data = [2, 3, 4, 5, 5, 6, 7, 10, 13, 14, 19]
centres = {
    "mean": statistics.mean(data),
    "median": statistics.median(data),
    "mode": statistics.mode(data),
}
print("range =", max(data) - min(data))
for name, c in centres.items():
print(f"M.D about the {name} ({c}) = {mean_deviation(data, c):.4f}")range = 17 M.D about the mean (8) = 4.3636 M.D about the median (6) = 4.0000 M.D about the mode (5) = 4.0909
Explain the codeڕوونکردنەوەی کۆدەکە
- Lineدێڕی 3-5
abs()removes the sign; dividing bylen(values)makes it a mean, not a sum.abs()نیشانەکە لادەبات؛ دابەشکردن بەlen(values)دەیکاتە تێکڕا، نەک کۆ.- Lineدێڕی 8-12
The three centres come from the
statisticsmodule.سێ چەقەکە لە
statisticsـەوە دێن.- Lineدێڕی 13
The range needs only
max()andmin().تەنها
max()وmin()ی پێویستە.
Common mistakesهەڵە باوەکان
| Mistakeهەڵە | Why it is wrongبۆچی هەڵەیە | Correctدروست |
|---|---|---|
| Averaging the signed deviationsتێکڕای بە نیشانەوە | They always add up to 0.کۆیان هەمیشە 0ـە. | Use (or squares). بەکاربهێنە (یان دووجا). |
| Stopping at the sum (48)وەستان لەسەر کۆکە (48) | A sum grows with n; M.D is a mean.کۆ بە n گەورە دەبێت؛ M.D تێکڕایە. | Divide by n: .دابەشی n بکە: . |
| Dividing grouped sums by the number of classesدابەشکردنی کۆی پۆلێنکراو بە ژمارەی | Each class holds many values.هەر چەندین نرخی تێدایە. | Divide by .دابەشی بکە. |
| Forgetting F in لەبیرکردنی F لە | Each midpoint stands for F values.هەر نوێنەری F نرخە. | Multiply every distance by its F.هەر دوورییەک لە F ـەکەی لێک بدە. |
| A slip in هەڵەیەکی بچووک لە | The mean and every deviation shift (Example 4: 294). و هەموو دەجووڵێن (نموونەی 4: 294). | Recheck each product before the mean.پێش هەموو لێکدانێک دووبارە بپشکنە. |
| Trusting the range with an outlierمتمانەکردن بە لەگەڵ | One value can make it huge.یەک نرخ دەتوانێت زۆر گەورەی بکات. | Look at M.D (or the IQR) too.سەیری M.D (یان IQR)ـیش بکە. |
Exercisesڕاهێنانەکان
Example 4 asks for the M.D using , and . Find the median and the mode of the table (continuous classes 0–10 … 40–50 with frequencies 5, 8, 15, 16, 6), then the M.D about each.
نموونەی 4 داوای M.D دەکات بە بەکارهێنانی ، و . و خشتەکە بدۆزەرەوە ( بەردەوام 0–10 … 40–50 بە 5، 8، 15، 16، 6)، پاشان M.D دەربارەی هەریەکەیان.
Hintئاماژە
Median class 20–30 (cumulative 5, 13, 28); modal class 30–40 with , .
20–30 (کەڵەکەبوو 5، 13، 28)؛ 30–40 بە ، .
Show answerوەڵامەکە پیشان بدە
Here the M.D about the mean (9.44) is smaller than about the median (9.56). That does not break the rule: in a table each value is replaced by its midpoint, and the median formula interpolates inside a class. The “median is smallest” rule holds for the raw values.
لێرەدا M.D دەربارەی (9.44) لە هی (9.56) بچووکترە. ئەمە یاساکە ناشکێنێت: لە خشتەدا هەر نرخێک بە گۆڕدراوە و فۆرمولەی لە ناو دەخەمڵێنێت. یاسای « بچووکترینە» بۆ نرخە خاوەکان ڕاستە.
Find the mean deviation about the mean for class A (66, 68, 69, 70, 70, 71, 72, 74) and class B (45, 52, 60, 70, 75, 82, 88, 88). Compare with their ranges.
دەربارەی بۆ پۆلی A (66، 68، 69، 70، 70، 71، 72، 74) و پۆلی B (45، 52، 60، 70، 75، 82، 88، 88) بدۆزەرەوە. بەراوردیان بکە لەگەڵ .
Show answerوەڵامەکە پیشان بدە
Class B is about 7.6 times as spread out by M.D , and about 5.4 times by range . Both measures agree on the order; they differ in how much weight the extremes get.
بە M.D پۆلی B نزیکەی 7.6 جار پەرتترە ؛ بە نزیکەی 5.4 جار . هەردوو پێوەر لەسەر ڕیزبەندییەکە ڕێکن؛ جیاوازییان لەوەدایە کە چەند کێش دەدەنە نرخە دوورەکان.
C (50, 70, 70, 70, 70, 70, 70, 90) and D (50, 55, 60, 65, 75, 80, 85, 90). Show that both have mean 70 and range 40, then compare their mean deviations.
C (50، 70، 70، 70، 70، 70، 70، 90) و D (50، 55، 60، 65، 75، 80، 85، 90). نیشانی بدە کە هەردووکیان 70 و 40یان هەیە، پاشان بەراورد بکە.
Show answerوەڵامەکە پیشان بدە
Both sums are 560, so both means are 70; both ranges are . , . The M.D sees what the range cannot: most of C sits on the mean.
کۆی هەردووکیان 560ـە، بۆیە هەردووکیان 70ـە؛ هەردووکیان ـە. ، . M.D ئەوە دەبینێت کە نایبینێت: زۆربەی C لەسەر .
Write a few lines of Python that compute the mean and the mean deviation of Example 4 from the lists F and X.
چەند دێڕێکی Python بنووسە کە و بۆ نموونەی 4 لە لیستەکانی F و X بژمێرێت.
Show answerوەڵامەکە پیشان بدە
F = [5, 8, 15, 16, 6]          # Example 4: classes 0-10, ..., 40-50
X = [5, 15, 25, 35, 45]        # midpoints

n = sum(F)
mean = sum(f * x for f, x in zip(F, X)) / n
md = sum(f * abs(x - mean) for f, x in zip(F, X)) / n
print("sum FX =", sum(f * x for f, x in zip(F, X)))
print("mean =", mean)
print("M.D =", md)sum FX = 1350 mean = 27.0 M.D = 9.44
Exercisesڕاهێنانەکان
Make your own data set: the school canteenکۆمەڵەدراوەیەکی خۆت دروست بکە: کافتریای قوتابخانە
Statistics starts with data you collect yourself. Choose a canteen or a small shop you know. For three items (for example fruit juice, biscuits and samosas) write down the purchase price and the sale price of one piece, and how many pieces are sold on each day of one school week. Also note the sale price of one item (a 250 ml fruit juice) from several companies. Then answer with the tools of this lesson: (a) Which item earns the most per piece? (b) Which item sells most on average, and whose daily sales are the least predictable? (c) How much do the juice prices of the companies vary?
بە دەست پێدەکات کە خۆت کۆی دەکەیتەوە. کافتریایەک یان دوکانێکی بچووک هەڵبژێرە کە دەیناسیت. بۆ سێ کاڵا (بۆ نموونە ئاوی میوە، بسکیت و سەمبووسە) نرخی کڕین و نرخی فرۆشتنی یەک دانە بنووسە، هەروەها لە هەر ڕۆژێکی هەفتەیەکی خوێندندا چەند دانە دەفرۆشرێت. نرخی فرۆشتنی یەک کاڵاش (ئاوی میوەی 250 ml) لە چەند کۆمپانیایەکەوە تۆمار بکە. پاشان بە ئامرازەکانی ئەم وانەیە وەڵام بدەرەوە: (أ) کام کاڵا لە هەر دانەیەکدا زۆرترین قازانج دەکات؟ (ب) کام کاڵا بە تێکڕا زۆرترین فرۆشتنی هەیە و فرۆشتنی ڕۆژانەی کامیان کەمتر پێشبینی دەکرێت؟ (ج) نرخی ئاوی میوەی کۆمپانیاکان چەند جیاوازە؟
Hintئاماژە
Use the mean for “on average”, and the range and the mean deviation for “how much it varies”. No canteen nearby? Use the data set in the answer.
بۆ «بە تێکڕا» بەکاربهێنە و بۆ «چەند دەگۆڕێت» و . کافتریات لە نزیک نییە؟ ئەو بەکاربهێنە کە لە وەڵامەکەدایە.
Show answerوەڵامەکە پیشان بدە
One possible data set (invented; prices in Iraqi dinars):
گونجاو (دروستکراو؛ نرخەکان بە دیناری عێراقی):
| Itemکاڵا | Purchase priceنرخی کڕین | Sale priceنرخی فرۆشتن | Profit per pieceقازانجی هەر دانەیەک |
|---|---|---|---|
| Fruit juice (250 ml)ئاوی میوە (250 ml) | 400 | 500 | 100 |
| Biscuits (one packet)بسکیت (یەک پاکەت) | 200 | 250 | 50 |
| Samosaسەمبووسە | 300 | 500 | 200 |
| Itemکاڵا | Pieces sold each dayدانە فرۆشراوەکانی هەر ڕۆژێک | Mean | Range | M.D |
|---|---|---|---|---|
| Fruit juiceئاوی میوە | 40, 35, 45, 50, 3040، 35، 45، 50، 30 | 40 | 20 | 6 |
| Biscuitsبسکیت | 25, 30, 20, 25, 2525، 30، 20، 25، 25 | 25 | 10 | 2 |
| Samosaسەمبووسە | 60, 20, 55, 65, 2560، 20، 55، 65، 25 | 45 | 45 | 18 |
(a) The samosa earns most per piece: 200 dinars, against 100 for juice and 50 for biscuits. (b) Samosas also sell most on average (45 a day), so they bring about dinars of profit a day, against 4000 for juice and 1250 for biscuits. But their sales are the least predictable: range 45 and M.D 18, against M.D 6 for juice and 2 for biscuits. Before ordering the same number of samosas every morning, the canteen should find out why some days sell only 20 (a short school day? an exam day?).
(أ) سەمبووسە لە هەر دانەیەکدا زۆرترین قازانج دەکات: 200 دینار، بەرامبەر 100 بۆ ئاوی میوە و 50 بۆ بسکیت. (ب) سەمبووسە بە تێکڕاش زۆرترین فرۆشتنی هەیە (ڕۆژانە 45)، بۆیە ڕۆژانە نزیکەی دینار قازانج دەهێنێت، بەرامبەر 4000 بۆ ئاوی میوە و 1250 بۆ بسکیت. بەڵام فرۆشتنەکەی کەمتر لە هەمووان پێشبینی دەکرێت: 45 و M.D 18، بەرامبەر M.D 6 بۆ ئاوی میوە و 2 بۆ بسکیت. پێش ئەوەی کافتریاکە هەموو بەیانییەک هەمان ژمارە سەمبووسە داوا بکات، باشە بزانێت بۆچی هەندێک ڕۆژ تەنها 20 دانە دەفرۆشرێت (ڕۆژێکی خوێندنی کورت؟ ڕۆژی تاقیکردنەوە؟).
(c) Five companies sell 250 ml of juice for 500, 750, 500, 1000 and 750 dinars. Mean , range , absolute deviations 200, 50, 200, 300, 50, so dinars: a typical juice price is 160 dinars away from the average price. To compare this spread with the spread of a much cheaper item, divide by the mean: the coefficient of variation.
(ج) پێنج کۆمپانیا 250 ml ئاوی میوە بە 500، 750، 500، 1000 و 750 دینار دەفرۆشن. ، ، 200، 50، 200، 300، 50، بۆیە دینار: نرخی ئاسایی ئاوی میوە نزیکەی 160 دینار لە تێکڕای نرخەکان دوورە. بۆ بەراوردکردنی ئەم لەگەڵ کاڵایەکی زۆر هەرزانتر، دابەشی بکە: هاوکۆلکەی گۆڕان.
import statistics

sales = {                      # pieces sold, Sunday to Thursday
    "juice":    [40, 35, 45, 50, 30],
    "biscuits": [25, 30, 20, 25, 25],
    "samosa":   [60, 20, 55, 65, 25],
}
profit = {"juice": 100, "biscuits": 50, "samosa": 200}   # dinars per piece

def mean_deviation(values):
    m = statistics.mean(values)
    return sum(abs(x - m) for x in values) / len(values)

for item, days in sales.items():
    m = statistics.mean(days)
    print(f"{item:8}  mean {m}  range {max(days) - min(days)}  "
          f"M.D {mean_deviation(days)}  profit/day {m * profit[item]}")

prices = [500, 750, 500, 1000, 750]       # 250 ml juice, five companies
print("juice prices: mean", statistics.mean(prices),
"range", max(prices) - min(prices), "M.D", mean_deviation(prices))juice mean 40 range 20 M.D 6.0 profit/day 4000 biscuits mean 25 range 10 M.D 2.0 profit/day 1250 samosa mean 45 range 45 M.D 18.0 profit/day 9000 juice prices: mean 700 range 500 M.D 160.0
Explain the codeڕوونکردنەوەی کۆدەکە
- Lineدێڕی 10-12
The mean deviation of one list, as in the screen Range and M.D in Python.
بۆ یەک ، وەک پەڕەی مەودا و M.D لە Pythonـدا.
- Lineدێڕی 14-17
Profit a day = mean pieces sold × profit per piece.
قازانجی ڕۆژانە = تێکڕای دانە فرۆشراوەکان × قازانجی هەر دانەیەک.
Summaryپوختە
- An average is not enough: data with the same mean can be close together or widely spread. Measures of dispersion describe the spread.
- Range: the largest minus the smallest value (grouped: the last upper limit minus the first lower limit). Easy, but it uses only two values, and one outlier can make it huge.
- Deviations from the mean always add up to 0, so signs must be removed.
- M.D: the mean of (A = mean, median or mode); grouped: . For raw data it is smallest about the median.
- Corrected numbers: Example 3 (about 4.0, about 4.0909); Example 4 , .
- ناوەند بەس نییە: بە هەمان دەکرێت لە یەکەوە نزیک یان زۆر پەرت بێت. پێوەرەکانی وەسف دەکەن.
- : گەورەترین نرخ کەم بچووکترین نرخ (پۆلێنکراو: دوایین سنووری سەرەوە کەم یەکەم سنووری خوارەوە). ئاسانە، بەڵام تەنها دوو نرخ بەکار دەهێنێت و یەک دەتوانێت زۆر گەورەی بکات.
- کۆی لە هەمیشە 0ـە، بۆیە دەبێت نیشانەکان لاببرێن.
- M.D: تێکڕای (A = ، یان )؛ پۆلێنکراو: . بۆ نرخی خاو دەربارەی بچووکترینە.
- ژمارە ڕاستکراوەکان: نموونەی 3، (دەربارەی 4.0، دەربارەی 4.0909)؛ نموونەی 4، ، .
Why can't we just average the deviations?بۆچی ناتوانین تەنها تێکڕای لادانەکان وەربگرین؟
Because positive and negative deviations from the mean cancel exactly; their sum is always 0.
چونکە ئەرێنی و نەرێنی لە ڕێک یەکتر دەسڕنەوە؛ کۆیان هەمیشە 0ـە.
Which is more robust to one extreme value, the range or the M.D?کامیان لە بەرامبەر یەک نرخی دووردا خۆڕاگرترە، مەودا یان M.D؟
The M.D: it uses all values, so one extreme value changes it less than the range, which is built only from the extremes.
M.D: هەموو نرخەکان بەکار دەهێنێت، بۆیە یەک نرخی دوور کەمتر دەیگۆڕێت لە ، کە تەنها لە دوو کۆتاییەکە دروست دەبێت.
What comes next?دواتر چی دێت؟
Squaring the deviations instead of taking absolute values gives the variance and the standard deviation: Variance and standard deviation.
دووجاکردنی لە جیاتی و دەدات: لێکنەچوون و لادانی پێوانەیی.
Lesson complete!وانەکە تەواو بوو!
Well done. Review the key terms, then go on to the next lesson.دەستخۆش. سەیرێکی زاراوە سەرەکییەکان بکەرەوە، پاشان بڕۆ بۆ وانەی داهاتوو.
Key termsزاراوە سەرەکییەکان
Variance and Standard Deviationلێکنەچوون و لادانی پێوانەیی
Related lecturesوانە پەیوەندیدارەکان
References and further readingسەرچاوەکان و خوێندنەوەی زیاتر
This lecture is a first edition. The Kurdish text and terminology are waiting for review by Kurdish IT teachers.ئەم وانەیە چاپی یەکەمە. دەقە کوردییەکە و زاراوەکانی چاوەڕێی پێداچوونەوەی مامۆستایانی کوردی بواری IT ن.