Chapterبەش 3 · Lectureوانە 3.4
Skewness, Kurtosis and the Mean–Median–Mode Relationناهاوجێبوون، پلەی لووتکەیی و پەیوەندیی نێوان ناوەند، ناوەڕاستە و باو
The shape of a distribution: which way its tail stretches (skewness) and how it compares with the normal curve (kurtosis) — Pearson's mean–median–mode rule, Pearson's two skewness coefficients, the moment coefficient and the kurtosis measure, with the course's examples recomputed and corrected.
شێوەی دابەشبوونێک: کلکەکەی بەرەو کام لا درێژ دەبێتەوە () و چۆن بەراورد دەکرێت بە () — یاسای پیرسن بۆ ، و ، دوو هاوکۆلکەکەی پیرسن بۆ ، هاوکۆلکەی و پێوەری ، لەگەڵ نموونەکانی کۆرسەکە کە دووبارە حیساب و ڕاست کراونەتەوە.
What you will learnچی فێر دەبیت
- Recognise positive, negative and zero skewness from a curve and from the order of the mean, median and mode.
- Use Pearson's approximate rule to find one average from the other two.
- Compute and interpret the skewness measures , and .
- Compute the kurtosis and name a curve mesokurtic, leptokurtic or platykurtic.
- موجەب، سالب و سفر لە هێڵێکەوە و لە ڕیزبەندیی ، و بناسیتەوە.
- یاسای نزیکەیی پیرسن بەکار بهێنیت بۆ دۆزینەوەی ناوەندێک لە دووەکەی تر.
- پێوەرەکانی ، و حیساب و لێک بدەیتەوە.
- حیساب بکەیت و هێڵێک بە ، یان ناو بنێیت.
Same centre, different shapeهەمان ناوەڕاست، شێوەی جیاواز
Averages tell you where the data sit, and the standard deviation tells you how spread out they are. But two data sets can have the same mean and the same spread and still look different. The third thing to look at is the shape: is the histogram balanced, or does it stretch out further on one side?
پێت دەڵێن لە کوێدان و لادانی پێوانەیی پێت دەڵێت چەند پەرتن. بەڵام دوو دەتوانن هەمان و هەمان پەرتبوونیان هەبێت و هێشتا جیاواز دەربکەون. شتی سێیەم کە سەیری دەکەین شێوەیە: ئایا هاوسەنگە، یان بەلایەکدا زیاتر درێژ دەبێتەوە؟
Think of three everyday data sets. Waiting times for the university bus: most are short, a few are very long. Marks in an easy quiz: most are high, a few are very low. Heights of adult men in a city: as many a bit taller as a bit shorter than usual. The picture shows their three shapes.
بیر لە سێ ڕۆژانە بکەرەوە. کاتی چاوەڕوانیی پاسی زانکۆ: زۆربەی جار کورتە و هەندێک جار زۆر درێژ. نمرەی تاقیکردنەوەیەکی ئاسان: زۆربەیان بەرزن و چەند دانەیەک زۆر نزمن. باڵای پیاوە پێگەیشتووەکانی شارێک: ئەوانەی کەمێک لە ئاسایی درێژترن هێندەی ئەوانەن کە کەمێک کورتترن. وێنەکە سێ شێوەکەیان نیشان دەدات.
Skewness: which way the tail pointsناهاوجێبوون: کلکەکە بەرەو کوێیە
How much a distribution leans to one side. A long tail to the right is positive skewness (mean > median > mode); to the left, negative.
ئەوەیە کە دابەشبوونێک چەند بەلایەکدا لار بووەتەوە. کلکێکی درێژ بەلای ڕاستدا ناهاوجێبوونی ئەرێنییە ( > > )؛ بەلای چەپدا نەرێنییە.
The course notes define skewness as how far a frequency curve is from being symmetric: one side of the curve has a longer tail than the other. A curve is symmetric when a vertical line through its centre splits it into two mirror images.
تێبینییەکانی کۆرسەکە بەم شێوەیە پێناسە دەکەن: ئەوەی هێڵی چەماوەی چەند لە هاوجێبوون دوورە؛ واتە لایەکی هێڵەکە کلکێکی درێژتری هەیە لە لاکەی تر. هێڵێک هاوجێیە کاتێک هێڵێکی ستوونی کە بە ناوەڕاستیدا دەڕوات دوو نیوەی وەک وێنەی ئاوێنە لێ دروست بکات.
- Longer tail on the right → positive skewness (skewed to the right).
- Longer tail on the left → negative skewness (skewed to the left).
- Both sides alike → skewness 0 (symmetric).
- کلکی درێژتر بەلای ڕاستدا ← موجەب (لار بەرەو ڕاست).
- کلکی درێژتر بەلای چەپدا ← سالب (لار بەرەو چەپ).
- هەردوو لا وەک یەک ← 0ـە (هاوجێ).
Symmetric, right-skewed and left-skewed shapes, where the mean, median and mode sit in each, and how a box plot shows the skew.
شێوەی هاوجێ، لار بەرەو ڕاست و لار بەرەو چەپ؛ شوێنی ، و لە هەر یەکەیاندا، هەروەها چۆن پیشان دەدات.
Whole video: which way the tail points, and where the three averages sit
هەموو ڤیدیۆکە: کلکەکە بەرەو کام لا درێژ دەبێتەوە و سێ تێکڕاکە لە کوێ دادەنیشن.
Skewness: which way the tail pointsناهاوجێبوون: کلکەکە بەرەو کوێیە
Why so many data sets lean to the rightبۆچی زۆر کۆمەڵەدراوە بەرەو ڕاست لارن
At a shared-taxi garage in Erbil, most cars leave a few minutes after arriving, as soon as they are full. On a quiet afternoon one car may wait an hour. Plot the waiting times and you get a tall pile of short waits and a thin tail of long ones stretching to the right: positive skewness. Waiting times cannot be less than zero, but they can be very long, so the tail can only grow to the right.
لە گەراجێکی تەکسیی هاوبەش لە هەولێر، زۆربەی ئۆتۆمبێلەکان چەند خولەکێک دوای گەیشتنیان، هەر کە پڕ بوون، دەڕۆن. لە نیوەڕۆیەکی بێدەنگدا لەوانەیە ئۆتۆمبێلێک کاتژمێرێک چاوەڕێ بکات. گەر کاتەکانی چاوەڕوانی بکەیتە هێڵکاری، کۆمەڵێکی بەرز لە چاوەڕوانیی کورت و کلکێکی باریک لە چاوەڕوانیی درێژ دەبینیت کە بەرەو ڕاست درێژ دەبێتەوە: موجەب. کاتی چاوەڕوانی ناتوانێت لە سفر کەمتر بێت، بەڵام دەتوانێت زۆر درێژ بێت، بۆیە کلکەکە تەنها بەرەو ڕاست گەشە دەکات.
Where the analogy stops workingسنووری ئەم نموونەیە
Real waiting times are lumpy and depend on the hour; the analogy only shows why a quantity with a floor (0) but no ceiling usually has a right tail.
کاتی چاوەڕوانیی ڕاستەقینە ناڕێکە و بە کاتژمێری ڕۆژ دەگۆڕێت؛ ئەم بەراوردە تەنها ئەوە نیشان دەدات بۆچی بڕێک کە زەوییەکی هەیە (0) بەڵام بنمیچی نییە، زۆرجار کلکێکی ڕاستی هەیە.
Skewness: which way the tail pointsناهاوجێبوون: کلکەکە بەرەو کوێیە
Where the mean, median and mode sitناوەند، ناوەڕاستە و باو لە کوێدان
In a single-peaked curve the mode is under the peak (the most common value), the median cuts the area into two equal halves, and the mean is the balance point. Every value pulls the mean towards itself, and a value far out in the tail pulls hard. The median only counts how many values lie on each side, so a far value moves it very little. That is why the mean is pulled furthest into the tail.
لە هێڵێکی تاکلووتکەدا لە ژێر لووتکەکەدایە (باوترین نرخ)، ڕووبەرەکە دەکاتە دوو نیوەی یەکسان و خاڵی هاوسەنگییە. هەموو نرخێک بەرەو خۆی ڕادەکێشێت و نرخێکی دوور لە کلکەکەدا بەهێزتر ڕایدەکێشێت. تەنها دەژمێرێت چەند نرخ لە هەر لایەکن، بۆیە نرخێکی دوور زۆر کەم دەیجووڵێنێت. لەبەر ئەمە زیاتر لە هەمووان بەرەو ناو کلکەکە ڕادەکێشرێت.
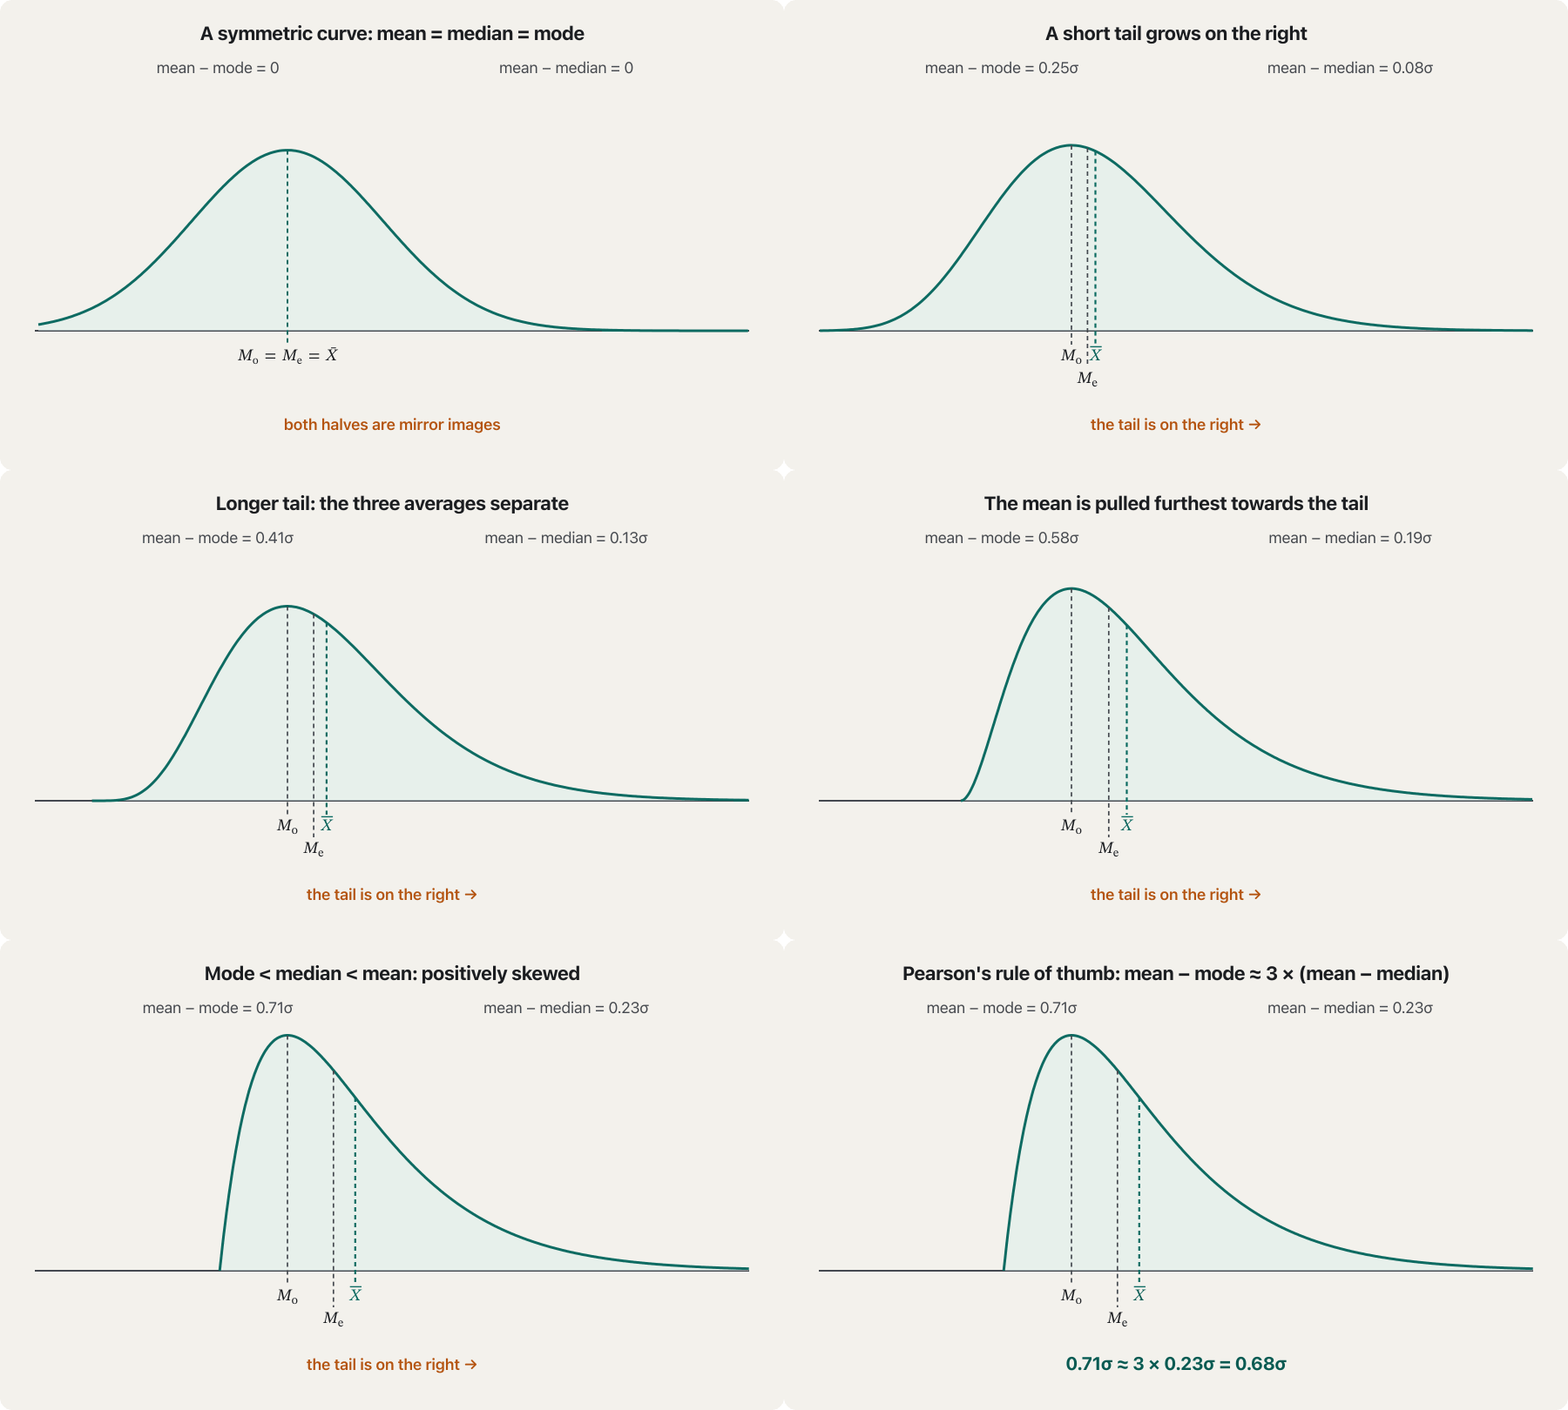
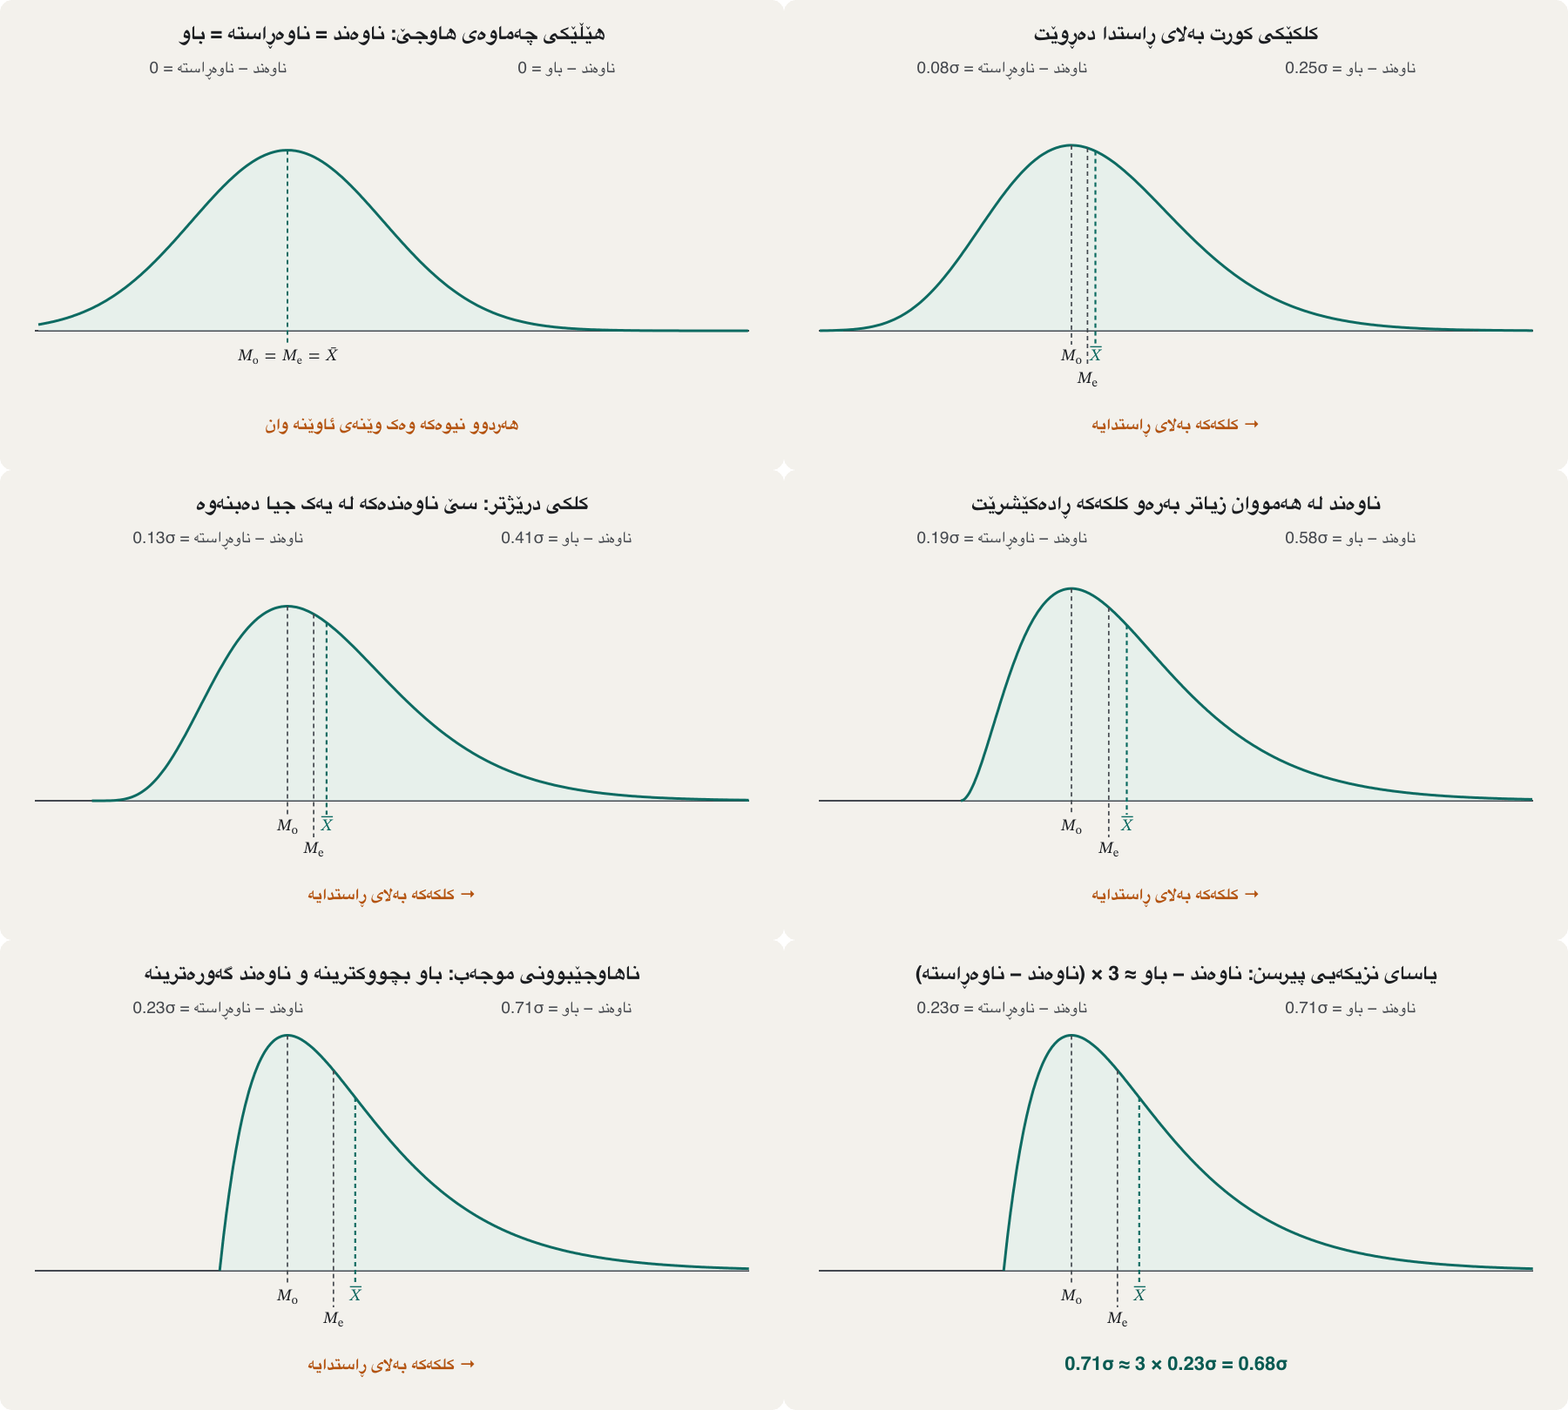
Skewness: which way the tail pointsناهاوجێبوون: کلکەکە بەرەو کوێیە
The usual order of the three averagesڕیزبەندیی ئاسایی سێ ناوەندەکە
| Shapeشێوە | Usual orderڕیزبەندیی ئاسایی | Skewness |
|---|---|---|
| Symmetric, one peakهاوجێ، یەک لووتکە | ||
| Long tail on the rightکلکی درێژ بەلای ڕاستدا | positiveموجەب | |
| Long tail on the leftکلکی درێژ بەلای چەپدا | negativeسالب |
Pearson's mean–median–mode ruleیاسای پیرسن بۆ ناوەند، ناوەڕاستە و باو
The statistician Karl Pearson noticed a pattern in curves that are only moderately skewed and have one peak: the distance from the mode to the mean is about three times the distance from the median to the mean. Written as a formula, with the course's symbols (mean), (median) and (mode):
ئاماریناس کارڵ پیرسن لە هێڵە چەماوەکاندا کە تەنها بە ڕادەیەکی مامناوەند لارن و یەک لووتکەیان هەیە، شێوازێکی تێبینی کرد: دووریی لە نزیکەی سێ ئەوەندەی دووریی لە . بە هێماکانی کۆرسەکە، ()، () و ()، دەنووسرێت:
The notes rearrange this one rule into four more forms, so you can find any one average from the other two:
تێبینییەکان ئەم یەک یاسایە دەکەن بە چوار شێوەی تر، تا بتوانیت هەر ناوەندێک لە دووەکەی تر بدۆزیتەوە:
Pearson's mean–median–mode ruleیاسای پیرسن بۆ ناوەند، ناوەڕاستە و باو
Example (19): the mean from the median and modeنموونەی (19): ناوەند لە ناوەڕاستە و باوەوە
- Example (19): what is givenنموونەی (19): چی دراوە
The median is and the mode is . Find the mean.
و ـە. بدۆزەرەوە.
- Use the mean formشێوەی ناوەند بەکار بهێنە
Put the two values into the form that has alone:
هەردوو نرخەکە بخەرە ئەو شێوەیەی کە بە تەنها تێیدایە:
- Check and read the shapeپشکنین و خوێندنەوەی شێوەکە
Check: and . The mean (51.5) is the smallest of the three and the mode (53) the largest, so the curve has its long tail on the left: negatively skewed.
پشکنین: و . (51.5) بچووکترینی هەر سێکەیە و (53) گەورەترینیان، بۆیە کلکە درێژەکەی هێڵەکە بەلای چەپـدایە: سالب.
Three measures of skewnessسێ پێوەری ناهاوجێبوون
A picture shows the direction of the skew. A number also says how strong it is, so two data sets can be compared. Each measure below divides by the standard deviation , so the answer has no unit: skewness of marks and skewness of salaries can be compared directly.
وێنە ئاڕاستەی لاربوونەکە نیشان دەدات. ژمارەیەک دەشڵێت چەند بەهێزە، تا بتوانرێت دوو بەراورد بکرێن. هەر یەک لەم پێوەرانەی خوارەوە دابەش دەکات بە ، بۆیە وەڵامەکە یەکەی نییە: نمرەکان و مووچەکان ڕاستەوخۆ بەراورد دەکرێن.
and are the second and third moments about the mean. The course notes write them , : there the small number is a label, not a power.
و دووەم و سێیەمن لە دەوری . تێبینییەکانی کۆرسەکە بە ، دەیاننووسن: لەوێدا ژمارە بچووکەکە تەنها نیشانەیە، نەک توان.
Putting a number on skewness: Pearson's coefficients (mean − mode)/S and 3(mean − median)/S, and the moment coefficient M3/S³.
پێوانەکردنی بە ژمارە: پیرسن و ، هەروەها .
Watch 4:28–10:52: Pearson's mode and median coefficients and the moment coefficient
لە 4:28 تا 10:52 سەیر بکە: پیرسن بە و بە ، هەروەها .
Three measures of skewnessسێ پێوەری ناهاوجێبوون
Reading the signخوێندنەوەی نیشانەکە
| Resultئەنجام | Shapeشێوە | |||
|---|---|---|---|---|
| equal to 0یەکسان بە 0 | symmetricهاوجێ | |||
| positiveموجەب | positively skewed موجەب | |||
| negativeسالب | negatively skewed سالب |
Why a cube in ? Cubing keeps the sign of each deviation: values above the mean give positive cubes, values below give negative ones. Cubing also makes far values count much more than near ones, so whichever side has the longer tail wins the sum, and the sign of tells you that side. The moments themselves are explained in Coefficient of Variation and Moments.
بۆچی سێجا لە ـدا؟ سێجاکردن نیشانەی هەر لادانێک دەپارێزێت: نرخەکانی سەرووی سێجای موجەب دەدەن و ئەوانەی خوارەوەی سێجای سالب. سێجاکردن هەروەها وا دەکات نرخە دوورەکان زۆر زیاتر لە نزیکەکان بژمێردرێن، بۆیە ئەو لایەی کلکی درێژتری هەیە کۆکە دەباتەوە و نیشانەی ئەو لایەت پێ دەڵێت. خودی لە هاوکۆلکەی گۆڕان و مۆمێنتەکان ڕوون کراونەتەوە.
Three measures of skewnessسێ پێوەری ناهاوجێبوون
Example (9): a slightly right-skewed data setنموونەی (9): کۆمەڵەدراوەیەکی کەمێک لار بەرەو ڕاست
Example (9) gives , median , mode and .
نموونەی (9) ئەمانە دەدات: ، ، و .
Positive: the curve is slightly skewed to the right.
موجەبە: هێڵەکە کەمێک بەرەو ڕاست لارە.
With Pearson's factor 3, (0.146) almost equals (0.145), as the rule of three predicts.
بە ژمارە 3ـی پیرسن، (0.146) نزیکەی یەکسانە بە (0.145)، وەک یاسای سێ پێشبینی دەکات.
Three measures of skewnessسێ پێوەری ناهاوجێبوون
H.W (5): skewness from momentsئەرکی (5): ناهاوجێبوون لە مۆمێنتەکانەوە
H.W (5) gives a grouped frequency table and its moments about the mean, and , and asks for .
ئەرکی (5) بۆ دەدات لەگەڵ لە دەوری ( و ) و داوای دەکات.
| Class | Midpoint X X | Frequency F F |
|---|---|---|
| 60–62 | 61 | 5 |
| 63–65 | 64 | 18 |
| 66–68 | 67 | 42 |
| 69–71 | 70 | 27 |
| 72–74 | 73 | 8 |
| Totalکۆ | 100 |
Negative but close to 0: the distribution is only slightly skewed to the left.
سالبە بەڵام نزیکە لە 0: دابەشبوونەکە تەنها کەمێک بەرەو چەپ لارە.
Kurtosis: compared with the normal curveپلەی لووتکەیی: بەراورد بە دابەشبوونی ئاسایی
How peaked or flat a distribution is compared with the . The excess kurtosis is 0 for the normal curve.
ئەوەیە کە دابەشبوونێک بە بەراورد لەگەڵ چەند لووتکەتیژ یان پانە. لووتکەیی زیادە بۆ چەماوەی ئاسایی 0ـە.
Skewness compares the two sides of a curve. Kurtosis compares a symmetric curve with the bell-shaped normal curve (the lesson The Normal Distribution later in this course is about it). The course notes say it measures how peaked or flat-topped the curve is. It is computed from the fourth and second moments about the mean:
دوو لای هێڵێک بەراورد دەکات. هێڵێکی هاوجێ بەراورد دەکات بە هێڵی زەنگئاسای (وانەی دابەشبوونی ئاسایی لە دواتری ئەم کۆرسەدا تایبەتە بەو). تێبینییەکانی کۆرسەکە دەڵێن ئەوە دەپێوێت هێڵەکە چەند لووتکەتیژ یان سەرپانـە. لە چوارەم و دووەم لە دەوری حیساب دەکرێت:
Here really is a square: is the variance, and .
لێرەدا بەڕاستی دووجایە: و .
Why minus 3? For the normal curve the ratio is exactly 3. Subtracting 3 makes the normal curve the zero point, so tells you how far a curve is from normal. This version is called excess kurtosis.
بۆچی کەمکردنەوەی 3؟ بۆ ڕێژەی ڕێک 3ـە. لابردنی 3 دەکاتە خاڵی سفر، بۆیە پێت دەڵێت هێڵێک چەند لە ئاسایی دوورە. ئەم شێوەیە پێی دەگوترێت زیادە (excess kurtosis).
Kurtosis compares tails with the normal curve: excess kurtosis 0 is normal, positive means heavier tails (leptokurtic), negative lighter (platykurtic).
کلکەکان بە چەماوەی بەراورد دەکات: کاتێک کەم 3 سفرە، دابەشبوونەکە ئاساییە؛ موجەب واتە کلکی قورستر ()، سالب واتە کلکی سووکتر ().
Watch 6:53–10:42: kurtosis as tailedness, excess kurtosis 0 for the normal curve, lepto-, meso- and platykurtic
لە 6:53 تا 10:42 سەیر بکە: وەک قورسیی کلکەکان، کەم 3 کە بۆ چەماوەی ئاسایی سفرە، پاشان ، و .
Kurtosis: compared with the normal curveپلەی لووتکەیی: بەراورد بە دابەشبوونی ئاسایی
Pearson's three types of curveسێ جۆرە هێڵەکەی پیرسن
- Mesokurtic (the normal curve): neither peaked nor flat, .
- Leptokurtic: more peaked than the normal curve, .
- Platykurtic: flatter than the normal curve, .
- (): نە لووتکەتیژە و نە پان، .
- : لە لووتکەتیژترە، .
- : لە پانترە، .
Kurtosis: compared with the normal curveپلەی لووتکەیی: بەراورد بە دابەشبوونی ئاسایی
Example (10)نموونەی (10)
Example (10) uses the same table as H.W (5): and .
نموونەی (10) هەمان خشتەی ئەرکی (5) بەکار دەهێنێت: و .
is negative, so the curve is platykurtic: a little flatter, with lighter tails, than the normal curve. Together with , this table is almost normal-shaped.
سالبە، بۆیە هێڵەکە : کەمێک پانترە و کلکی سووکتری هەیە لە . لەگەڵ ، ئەم خشتەیە نزیکەی شێوەی ئاسایی هەیە.
Shape numbers in Pythonژمارەکانی شێوە لە Pythonـدا
Python's built-in statistics module has no skewness function, but the moments take only a few lines. This program recomputes H.W (5) and Example (10) from the table:
statistics لە Pythonـدا هیچ بۆ تێدا نییە، بەڵام تەنها چەند دێڕێک دەخایەنن. ئەم بەرنامەیە ئەرکی (5) و نموونەی (10) لە خشتەکەوە دووبارە حیساب دەکاتەوە:
midpoints = [61, 64, 67, 70, 73]      # classes 60-62, 63-65, ..., 72-74
freq      = [5, 18, 42, 27, 8]        # H.W (5), last frequency corrected to 8

N = sum(freq)
mean = sum(f * x for x, f in zip(midpoints, freq)) / N

def moment(k):
    """k-th moment about the mean: sum F(X - mean)^k / N"""
    return sum(f * (x - mean) ** k for x, f in zip(midpoints, freq)) / N

M2, M3, M4 = moment(2), moment(3), moment(4)
alpha3 = M3 / M2 ** 1.5               # skewness
B = M4 / M2 ** 2 - 3                  # kurtosis (excess)

print(f"N = {N}, mean = {mean}")
print(f"M2 = {M2:.4f}, M3 = {M3:.4f}, M4 = {M4:.4f}")
print(f"alpha3 = {alpha3:.4f}")
print(f"B = {B:.4f}")N = 100, mean = 67.45 M2 = 8.5275, M3 = -2.6933, M4 = 199.3759 alpha3 = -0.1082 B = -0.2582
Explain the codeڕوونکردنەوەی کۆدەکە
- Lineدێڕی 7-9
moment(k)is the k-th moment about the mean: each midpoint's distance from the mean, raised to the power k, weighted by its frequency.moment(k)ـەمە لە دەوری : دووریی هەر لە ، بەرز کراوەتەوە بۆ توانی و بە کێش کراوە.- Lineدێڕی 12-13
M2 ** 1.5is ;M2 ** 2is .M2 ** 1.5هەمان ـە؛M2 ** 2هەمان ـە.
Common mistakesهەڵە باوەکان
| Mistakeهەڵە | Correct ideaبیرۆکەی ڕاست |
|---|---|
| "The peak is on the right, so it is right-skewed."«لووتکەکە لە ڕاستە، کەواتە لار بەرەو ڕاستە.» | Skewness is named after the long tail. A peak on the right means a tail on the left: negative. بە ناوی کلکە درێژەکە ناو دەنرێت. لووتکە لە ڕاست واتە کلک لە چەپ: سالب. |
| Writing Pearson's rule with "=" and using it for any data.نووسینی یاسای پیرسن بە «=» و بەکارهێنانی بۆ هەموو . | It is , for single-peaked, moderately skewed curves only.ـە، تەنها بۆ هێڵی تاکلووتکەی بە ڕادەیەکی مامناوەند لار. |
| Forgetting the 3 in the median coefficient.لەبیرکردنی 3 لە هاوکۆلکەی . | ; then .؛ ئەوسا . |
| Dividing by .دابەشکردنی بە . | Divide by .دابەشی بکە بە . |
| Forgetting the in , so the normal curve gets 3.لەبیرکردنی لە ـدا، بەمەش 3 وەردەگرێت. | ; for the normal curve .؛ بۆ . |
| "The mean equals the median, so the data are symmetric."« و یەکسانن، کەواتە هاوجێیە.» | Usually true for smooth curves, but not a proof; look at the graph.بۆ هێڵە ڕێکەکان زۆرجار ڕاستە، بەڵام سەلماندن نییە؛ سەیری هێڵکارییەکە بکە. |
Exercisesڕاهێنانەکان
The median of a distribution is 52 and the mode is 53. Estimate the mean and say which way the distribution is skewed.
دابەشبوونێک 52 و 53ـە. بخەمڵێنە و بڵێ دابەشبوونەکە بەرەو کام لا لارە.
Show answerوەڵامەکە پیشان بدە
(): negatively skewed, long tail on the left.
(): سالب، کلکی درێژ بەلای چەپدا.
A moderately skewed distribution has mean 45 and mode 42. Estimate the median.
دابەشبوونێکی بە ڕادەیەکی مامناوەند لار 45 و 42ـی هەیە. بخەمڵێنە.
Show answerوەڵامەکە پیشان بدە
Check: and . (): positively skewed.
پشکنین: و . (): موجەب.
, , , . Compute and and describe the shape.
، ، ، . و حیساب بکە و شێوەکە وەسف بکە.
Show answerوەڵامەکە پیشان بدە
Both positive and small: slightly positively skewed. (The notes' without the 3: 0.0487 with the given median, 0.0449 with 79.06.)
هەردووکیان موجەب و بچووکن: کەمێک موجەب. (ـی تێبینییەکان بەبێ 3: 0.0487 بە دراو و 0.0449 بە 79.06.)
For the table 60–62: 5, 63–65: 18, 66–68: 42, 69–71: 27, 72–74: 8 the moments about the mean are , . Find .
بۆ خشتەی 60–62: 5، 63–65: 18، 66–68: 42، 69–71: 27، 72–74: 8، لە دەوری و ـن. بدۆزەرەوە.
Show answerوەڵامەکە پیشان بدە
Slightly negatively skewed.
کەمێک سالب.
With and , find and name the type of curve.
بە و ، بدۆزەرەوە و جۆری هێڵەکە ناو بنێ.
Show answerوەڵامەکە پیشان بدە
, so the curve is platykurtic.
چونکە ، هێڵەکە .
Set 1 is 1, 2, 2, 3, 3, 3, 4, 4, 5. Set 2 is the same, but the 5 is replaced by 14. For each set, find the mean, median, mode, and .
یەکەم بریتییە لە 1، 2، 2، 3، 3، 3، 4، 4، 5. دووەم هەمانە، بەڵام 5 بە 14 گۆڕدراوە. بۆ هەر یەکێکیان ، ، ، و بدۆزەرەوە.
Hintئاماژە
Use . For Set 2 the mean is 4, so .
بەکار بهێنە. بۆ دووەم 4ـە، بۆیە .
Show answerوەڵامەکە پیشان بدە
| Setکۆمەڵە | Mean | Median | Mode | |||||
|---|---|---|---|---|---|---|---|---|
| 1 | 3 | 3 | 3 | 0 | 4 | 0 | ||
| 2 | 4 | 3 | 3 | 106 | 1124 | 2.18 | 3.32 |
Set 1 is symmetric () and a little flat (). Moving one value far out makes Set 2 strongly right-skewed () and leptokurtic (): the mean jumps from 3 to 4 while the median and mode stay at 3.
یەکەم هاوجێیە () و کەمێک پانە (). بردنی تەنها یەک نرخ بۆ دوور، دووەم بە بەهێزی بەرەو ڕاست لار دەکات () و دەکات (): لە 3ـەوە بازدەدات بۆ 4 کەچی و لە 3 دەمێننەوە.
Say whether each is most likely positively skewed, negatively skewed or symmetric: (a) the number of children in families; (b) the age at which people retire; (c) the error of a well-made kitchen scale.
بڵێ هەر یەکێک لەمانە بە زۆری موجەبی هەیە، سالب، یان هاوجێیە: (أ) ژمارەی منداڵانی خێزانەکان؛ (ب) ئەو تەمەنەی خەڵک خانەنشین دەبن؛ (ج) هەڵەی تەرازوویەکی چێشتخانەی باش دروستکراو.
Show answerوەڵامەکە پیشان بدە
- (a) Positive: it cannot go below 0, but a few families are very large.
- (b) Negative: most people retire near the legal age, a few retire much earlier.
- (c) Symmetric: small errors up and down are equally likely.
- (أ) موجەب: ناتوانێت لە 0 کەمتر بێت، بەڵام چەند خێزانێک زۆر گەورەن.
- (ب) سالب: زۆربەی خەڵک نزیک تەمەنی یاسایی خانەنشین دەبن و چەند کەسێک زۆر زووتر.
- (ج) هاوجێ: هەڵەی بچووکی سەرەوە و خوارەوە هێندەی یەک دەگونجێن.
Summaryپوختە
- Skewness describes the tail: long right tail → positive; long left tail → negative; symmetric → 0.
- The mean is pulled furthest into the tail: usually for a right tail.
- Pearson's rule (approximate): .
- Measures: , , .
- Kurtosis : mesokurtic (normal), leptokurtic, platykurtic; it is driven mostly by the tails.
- کلکەکە وەسف دەکات: کلکی درێژی ڕاست ← موجەب؛ کلکی درێژی چەپ ← سالب؛ هاوجێ ← 0.
- زیاتر لە هەمووان بەرەو کلکەکە ڕادەکێشرێت: بۆ کلکی ڕاست زۆرجار .
- یاسای پیرسن (نزیکەیی): .
- پێوەرەکان: ، ، .
- : (ئاسایی)، ، ؛ زۆرتر بە کلکەکان دیاری دەکرێت.
Why is the mean, not the median, pulled into the tail?بۆچی ناوەند، نەک ناوەڕاستە، بەرەو کلکەکە ڕادەکێشرێت؟
The mean uses the size of every value, so far values pull it strongly. The median only depends on the order of the values.
قەبارەی هەموو نرخێک بەکار دەهێنێت، بۆیە نرخە دوورەکان بە بەهێزی ڕایدەکێشن. تەنها پشت بە ڕیزبەندیی نرخەکان دەبەستێت.
What does mean? واتای چییە؟
The curve has the same kurtosis as the normal curve (mesokurtic).
هێڵەکە هەمان لەگەڵ هەیە ().
Why divide by (or ) in the skewness measures?بۆچی لە پێوەرەکانی ناهاوجێبووندا بە (یان ) دابەش دەکەین؟
To remove the unit, so data sets measured in different units can be compared.
بۆ لابردنی یەکەکە، تا کە بە یەکەی جیاواز پێوراون بەراورد بکرێن.
Lesson complete!وانەکە تەواو بوو!
Well done. Review the key terms, then go on to the next lesson.دەستخۆش. سەیرێکی زاراوە سەرەکییەکان بکەرەوە، پاشان بڕۆ بۆ وانەی داهاتوو.
Key termsزاراوە سەرەکییەکان
What Is Probability?ئەگەرێتی چییە؟
Related lecturesوانە پەیوەندیدارەکان
- Histograms and Cumulative Frequency Graphsهیستۆگرامەکان و هێڵکارییەکانی دووبارەبوونەوەی کەڵەکەبوو
- Quartiles, Percentiles and Box Plots (Supplementary)چواریەکەکان، سەدیەکەکان و هێڵکارییە سندووقییەکان (زیادە)
- The Arithmetic Mean and the Weighted Meanناوەند و ناوەندی قورسکراو
- The Normal Distribution (Supplementary)دابەشبوونی ئاسایی (زیادە)
References and further readingسەرچاوەکان و خوێندنەوەی زیاتر
- OpenStax, Introductory Statistics 2e, 2.6 Skewness and the Mean, Median, and Mode (order of the averages; "not true for every data set")
- Wikipedia: Skewness (Pearson's first and second coefficients, moment coefficient, the mean–median rule of thumb and its failures)
- Wikipedia: Kurtosis (excess kurtosis, mesokurtic/leptokurtic/platykurtic, kurtosis as a measure of the tails)
This lecture is a first edition. The Kurdish text and terminology are waiting for review by Kurdish IT teachers.ئەم وانەیە چاپی یەکەمە. دەقە کوردییەکە و زاراوەکانی چاوەڕێی پێداچوونەوەی مامۆستایانی کوردی بواری IT ن.