Chapterبەش 5 · Lectureوانە 5.7
The Normal Distribution (Supplementary)دابەشبوونی ئاسایی (زیادە)
The bell curve: why it appears (a Galton board), how and shape it, the 68–95–99.7 rule, z-scores and the standard normal, probabilities as areas with Python's NormalDist instead of tables, the binomial–normal link, and a look back over the whole course.
چەماوەی زەنگوڵەئاسا: بۆچی دەردەکەوێت ()، و چۆن شێوەی دەدەن، ، و ، وەک ڕووبەر بە NormalDistـی Python لە جیاتی خشتە، پەیوەندیی دووڕادەیی–ئاسایی و ئاوڕدانەوەیەک بە هەموو کۆرسەکەدا.
What you will learnچی فێر دەبیت
- Describe the normal distribution and explain why bell curves are common.
- Use the 68–95–99.7 rule and z-scores to judge how unusual a value is.
- Find normal probabilities and percentiles with
statistics.NormalDist. - Approximate a binomial distribution with a normal curve when is large.
- وەسف بکەیت و ڕوون بکەیتەوە بۆچی چەماوەی زەنگوڵەئاسا زۆرە.
- و بەکاربهێنیت بۆ ئەوەی بزانیت نرخێک چەند نائاساییە.
- و ئاسایی بە
statistics.NormalDistبدۆزیتەوە. - بە چەماوەیەکی ئاسایی نزیک بکەیتەوە کاتێک گەورەیە.
The bell curveچەماوەی زەنگوڵەئاسا
A machine in a bazaar fills 1 kg bags of rice. No machine is perfect: one bag holds 1003 g, the next 994 g, the next 1001 g. Weigh thousands of bags and draw a histogram. Most bags are close to 1000 g, fewer are far away, and the two sides look alike. Make the classes narrower and narrower and the tops of the bars trace a smooth bell-shaped curve.
ئامێرێک لە بازاڕدا کیسەی برنجی 1 کیلۆیی پڕ دەکاتەوە. هیچ ئامێرێک بێ کەموکوڕی نییە: کیسەیەک 1003 گرامی تێدایە، دواتر 994 گرام، دواتر 1001 گرام. هەزاران کیسە بکێشە و هیستۆگرامێک بکێشە. زۆربەی کیسەکان نزیکی 1000 گرامن، کەمتر دوورن و هەردوو لا وەک یەک دەردەکەون. باریکتر و باریکتر بکە و سەری ستوونەکان چەماوەیەکی لووسی زەنگوڵەئاسا دەکێشن.
This curve is the density of the normal distribution, the most used model in statistics. Many measurements are close to normal: weights from a filling machine, people's heights, errors of a measuring instrument, marks of a large exam. As for every continuous random variable, probability is area under the curve.
ئەم چەماوەیە چڕیی ، کە بەکارهاتووترین مۆدێلی . زۆر پێوانە نزیکن لە ئاسایی: کێشی ئامێرێکی پڕکردنەوە، باڵای خەڵک، هەڵەی ئامێرێکی پێوان، نمرەکانی تاقیکردنەوەیەکی گەورە. وەک هەموو گۆڕاوێکی هەڕەمەکیی بەردەوام، ڕووبەرـە لە ژێر چەماوەکەدا.
The symmetric, bell-shaped distribution set by its and . Many measurements, such as heights, are close to normal.
دابەشبوونە هاوجێ و زەنگوڵەئاساکەیە کە بە و دیاری دەکرێت. زۆر پێوانە، وەک باڵا، نزیکن لە ئاسایی.
Why bells appear: the Galton boardبۆچی زەنگوڵە دەردەکەوێت: تەختەی گاڵتن
A Galton board shows where the bell comes from. Each ball falls through 12 rows of pins and at every pin it bounces left or right with equal chance. Its final bin is the number of right bounces, so it is binomial, . Watch 1,000 balls pile up:
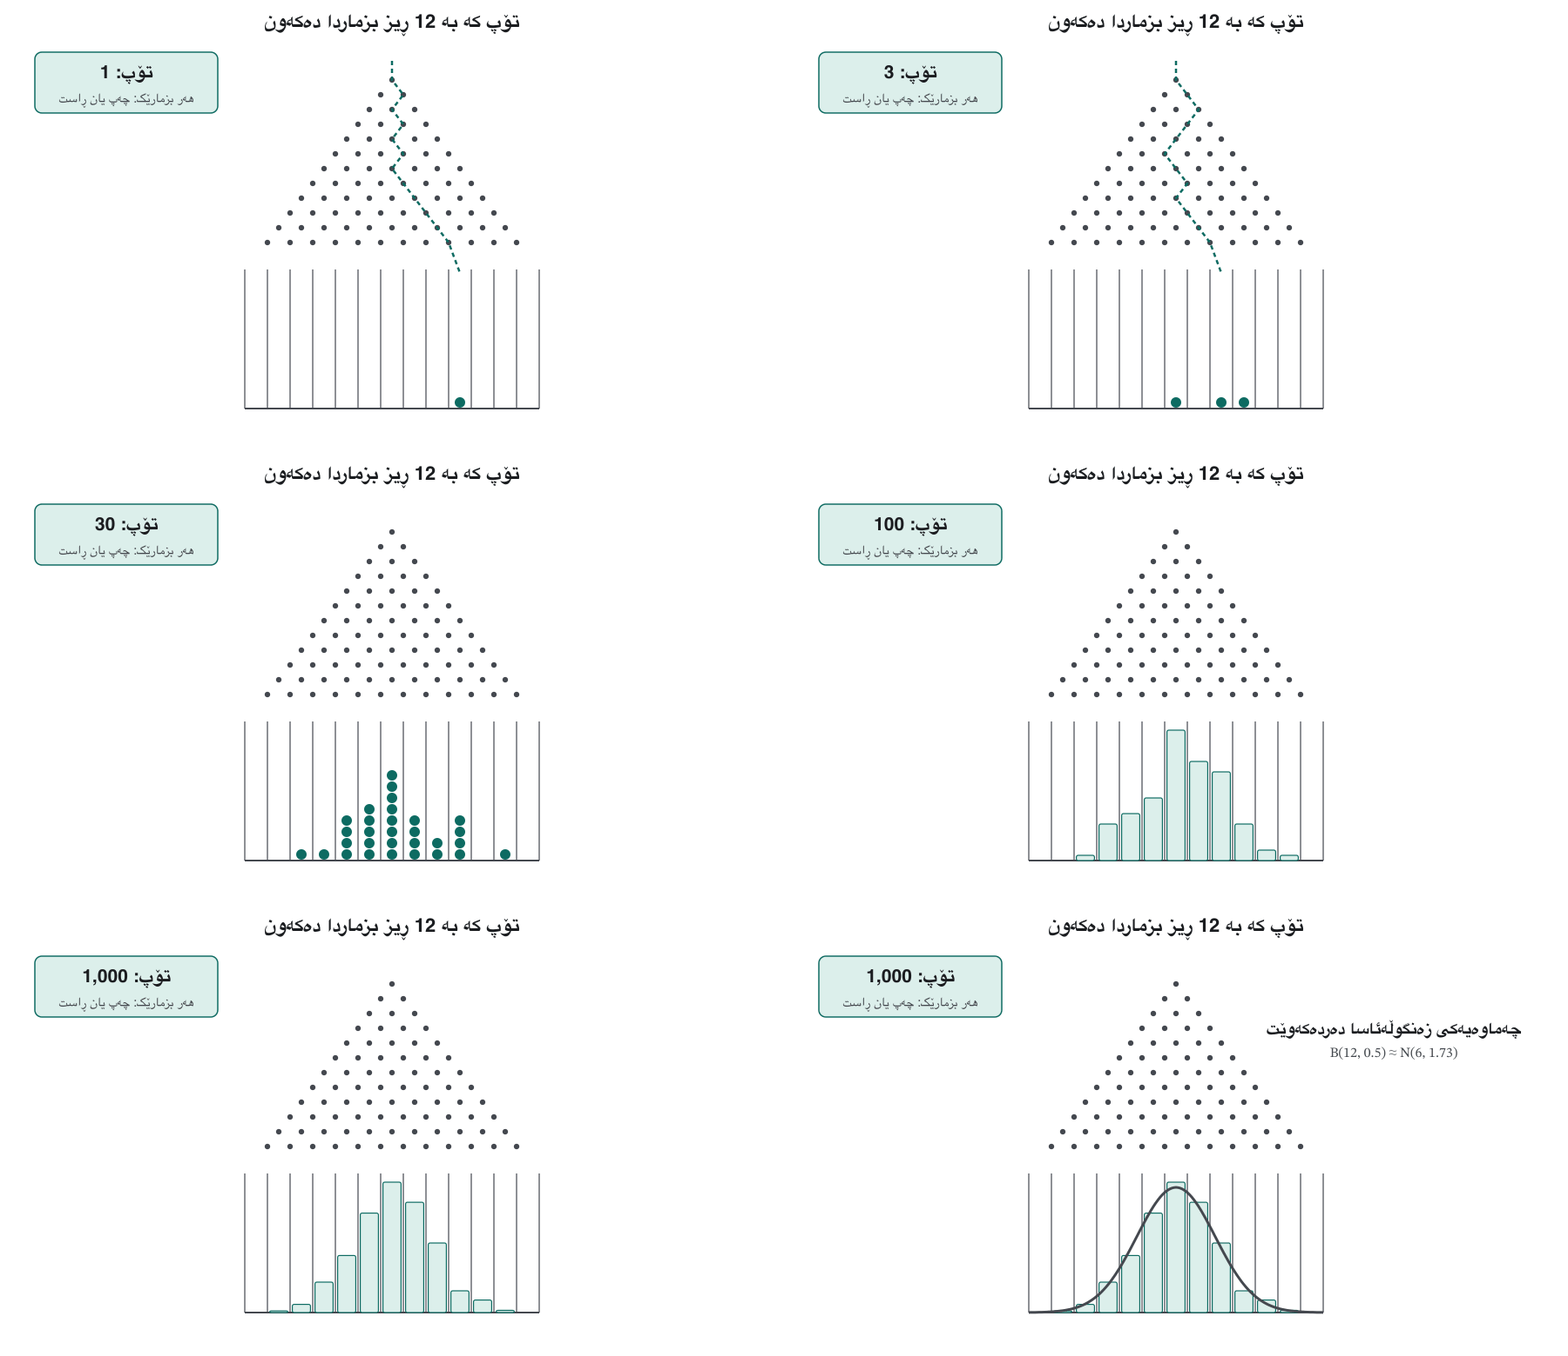
نیشان دەدات زەنگوڵەکە لە کوێوە دێت. هەر تۆپێک بە 12 ڕیز بزماردا دەکەوێت و لە هەر بزمارێکدا بە چانسی یەکسان بەرەو چەپ یان ڕاست دەچێت. ئەو خانەیەی تێیدا دەوەستێت ژمارەی چوونەکانی بەرەو ڕاستە، بۆیە دووڕادەییە، . سەیری کۆبوونەوەی 1,000 تۆپ بکە:
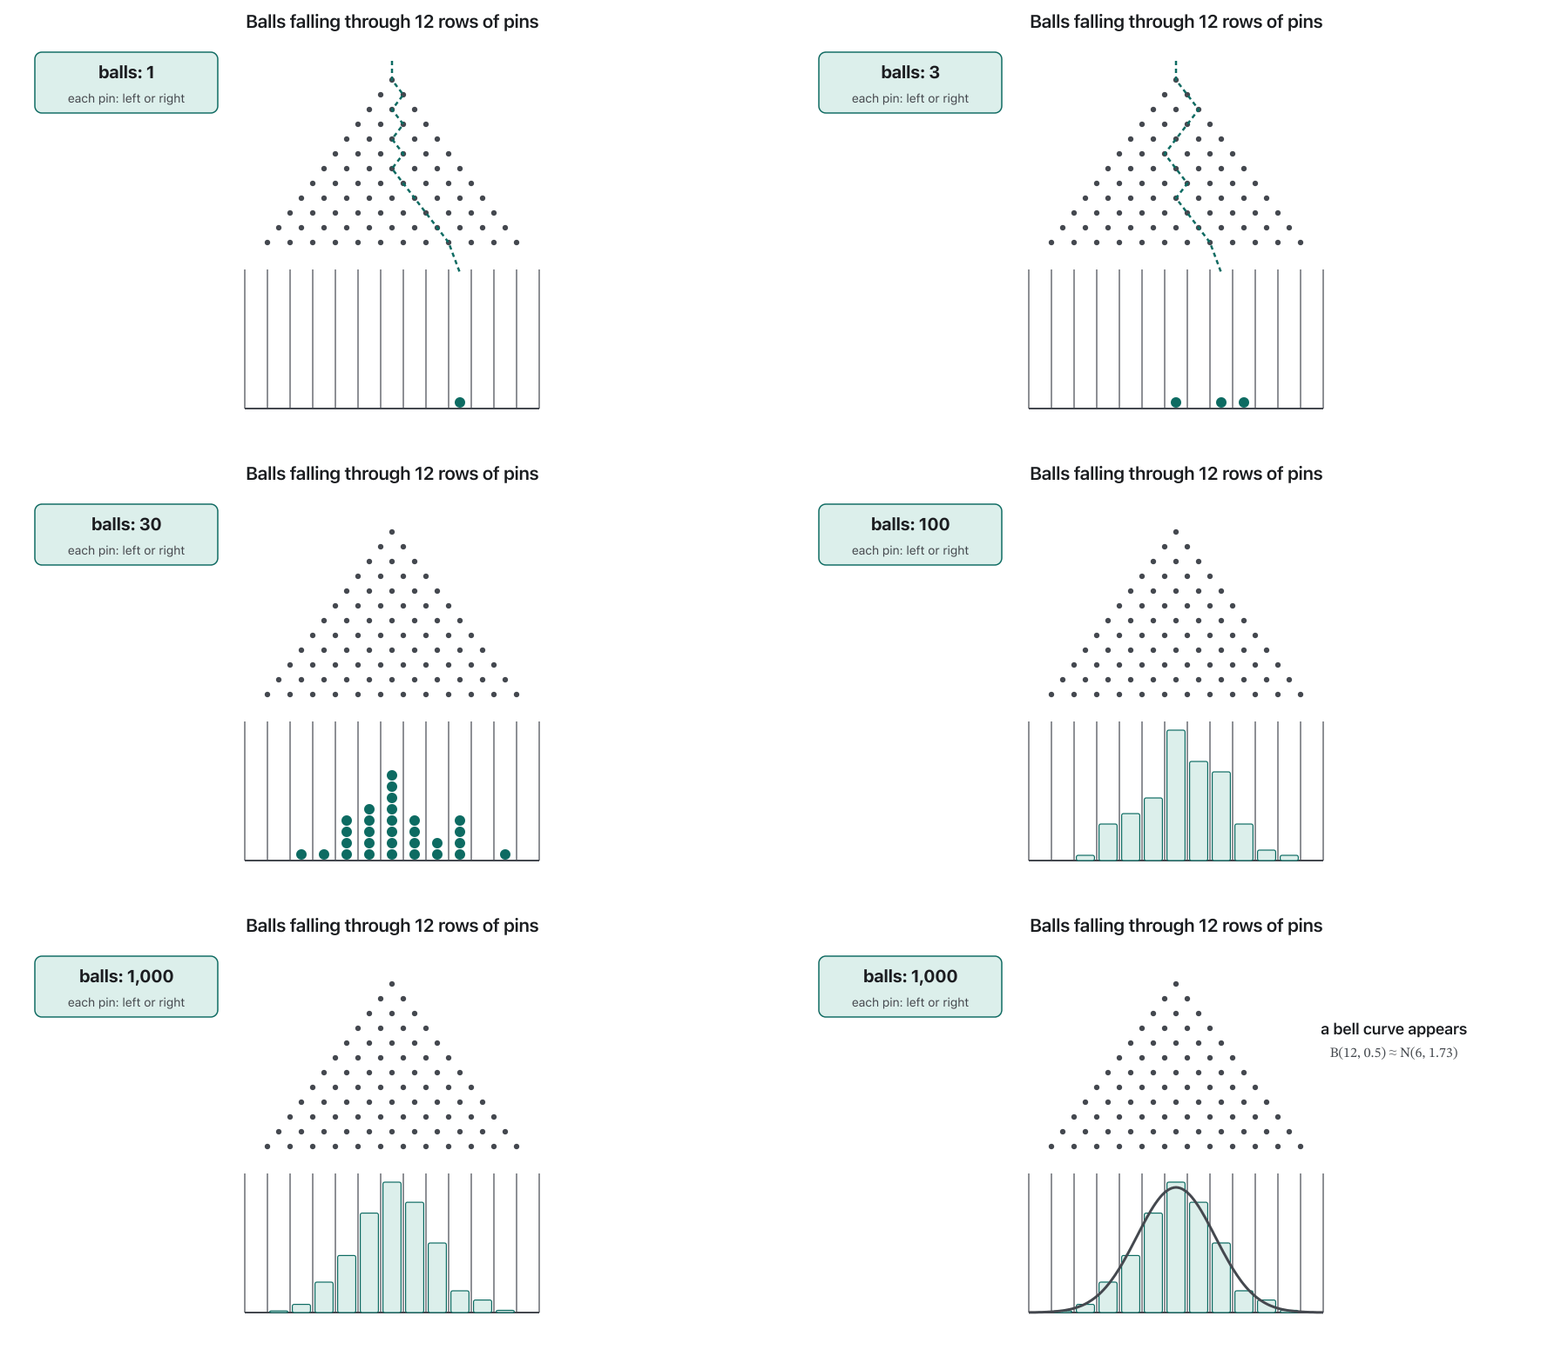
Few balls reach the edge bins: to land in bin 0 a ball must go left 12 times in a row, probability . The middle bin 6 can be reached in ways. A bag of rice is like a ball: many small causes (grain size, vibration, timing) each push its weight a little up or down.
تۆپی کەم دەگەنە خانەکانی لێوار: بۆ گەیشتن بە خانەی 0 تۆپێک دەبێت 12 جار لە سەر یەک بەرەو چەپ بچێت، . خانەی ناوەڕاست 6 بە ڕێگا دەگاتێ. کیسەیەک برنج وەک تۆپێکە: زۆر هۆکاری بچووک (قەبارەی دەنک، لەرزین، کات) هەریەکە کێشەکەی کەمێک بەرز یان نزم دەکات.
A Galton board: each ball bounces left or right at every pin, adding many small random steps, and the piles form a bell curve.
: هەر تۆپێک لە هەر بزمارێکدا بەرەو چەپ یان ڕاست دەچێت، زۆر هەنگاوی بچووکی هەڕەمەکی کۆ دەبنەوە و کەڵەکەکان چەماوەیەکی زەنگوڵەیی دروست دەکەن.
Chapters 'A simplified Galton board' and 'The general idea' (1:53-6:15): sums of many independent bounces pile up into a bell.
بەشەکانی « سادەکراو» و «بیرۆکە گشتییەکە» (1:53 تا 6:15): کۆی زۆر بازدانی سەربەخۆ کەڵەکە دەبن و دەبنە زەنگوڵەیەک.
Two numbers fix the curve: and دوو ژمارە چەماوەکە دیاری دەکەن: و
Every normal curve is set by its mean and its standard deviation . We write . puts the peak in its place; decides how wide the bell is:
هەموو چەماوەیەکی ئاسایی بە و دیاری دەکرێت. دەنووسین . لووتکەکە لە شوێنی خۆی دادەنێت؛ بڕیار دەدات زەنگوڵەکە چەند پانە:
The density of . You will rarely use it by hand: computers and tables give the areas. The square makes it symmetric, and to a negative power makes it fall fast in the tails.
چڕیی . بە دەگمەن بە دەست بەکاری دەهێنیت: و خشتەکان ڕووبەرەکان دەدەن. دووجای هاوجێی دەکات و بە سالب وا دەکات لە کلکەکاندا بە خێرایی دابەزێت.
Two numbers fix the curve: and دوو ژمارە چەماوەکە دیاری دەکەن: و
Four facts about every normal curveچوار ڕاستی دەربارەی هەموو چەماوەیەکی ئاسایی
Whatever and are, every normal curve has these properties:
و هەرچییەک بن، هەموو چەماوەیەکی ئاسایی ئەم تایبەتمەندییانەی هەیە:
- Symmetric about , so the mean, the median and the mode all equal , and its skewness is 0.
- The total area is 1. The tails get very close to the axis but never touch it: any value is possible, far values are just very unlikely.
- The curve changes from bending down to bending up exactly at and : you can read off the picture.
- It is the mesokurtic reference curve: , so its excess kurtosis B is 0.
- هاوجێیە بە دەوری ـدا، بۆیە ، و هەموویان یەکسانن بە و ناهاوجێبوونی 0ـە.
- کۆی ڕووبەر 1ـە. کلکەکان زۆر لە تەوەرەکە نزیک دەبنەوە بەڵام هەرگیز پێی ناگەن: هەموو نرخێک دەکرێت ڕوو بدات، تەنها نرخە دوورەکان زۆر کەمە.
- چەماوەکە ڕێک لە و لە چەمانەوە بەرەو خوارەوە دەگۆڕێت بۆ چەمانەوە بەرەو سەرەوە: دەتوانیت لە وێنەکەوە بخوێنیتەوە.
- چەماوەی بنەڕەتیی : ، بۆیە ـی پلەی لووتکەیی دەکاتە 0.
The 68–95–99.7 ruleیاسای 68–95–99.7
For every normal distribution the same share of the area lies within 1, 2 and 3 standard deviations of the mean. Watch the bands fill in:
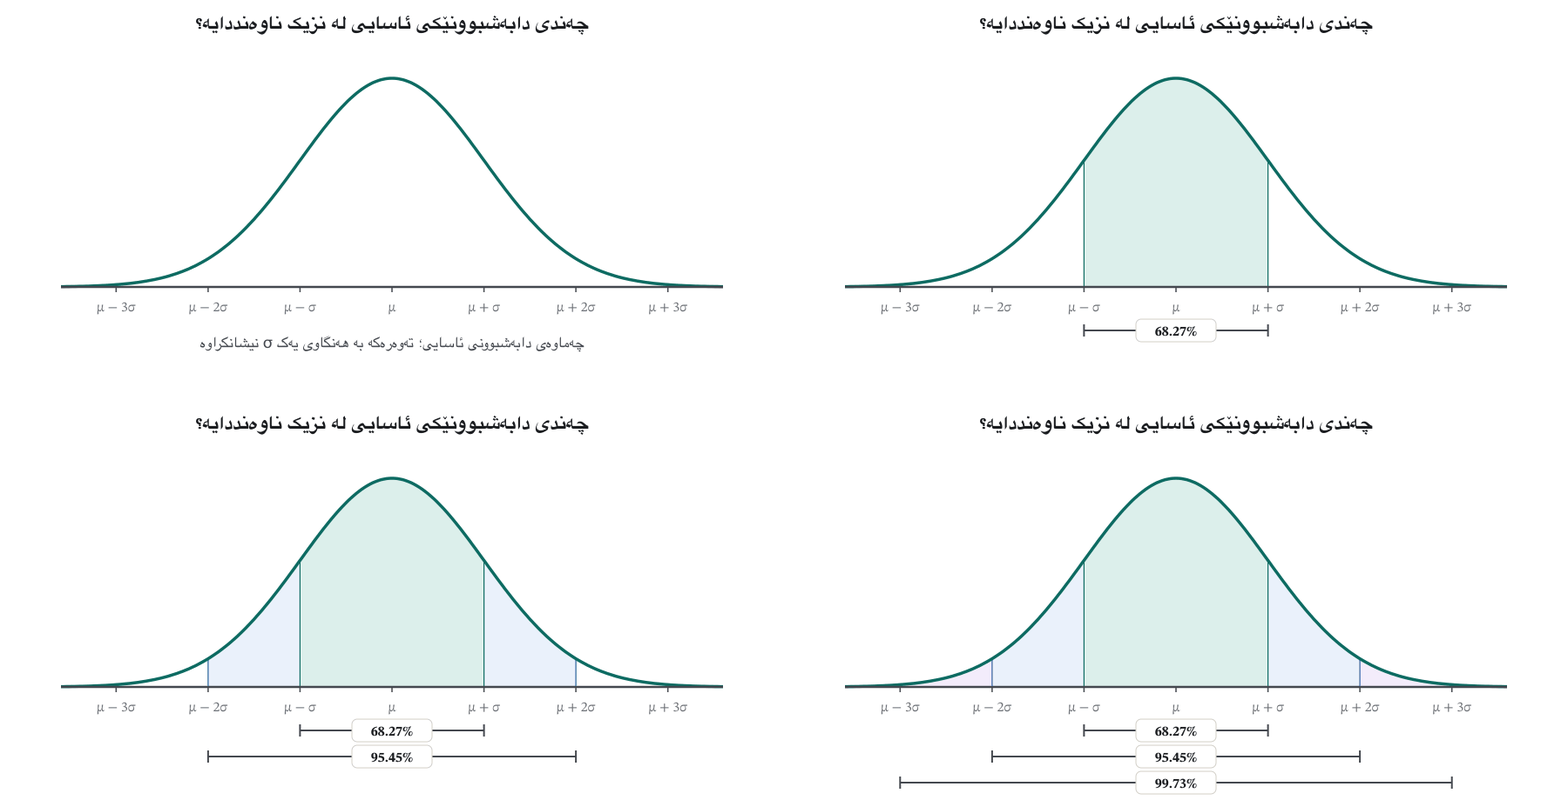
بۆ هەموو هەمان بەشی ڕووبەر لە ماوەی 1، 2 و 3 لە دەوری . سەیری پڕبوونەوەی ناوچەکان بکە:
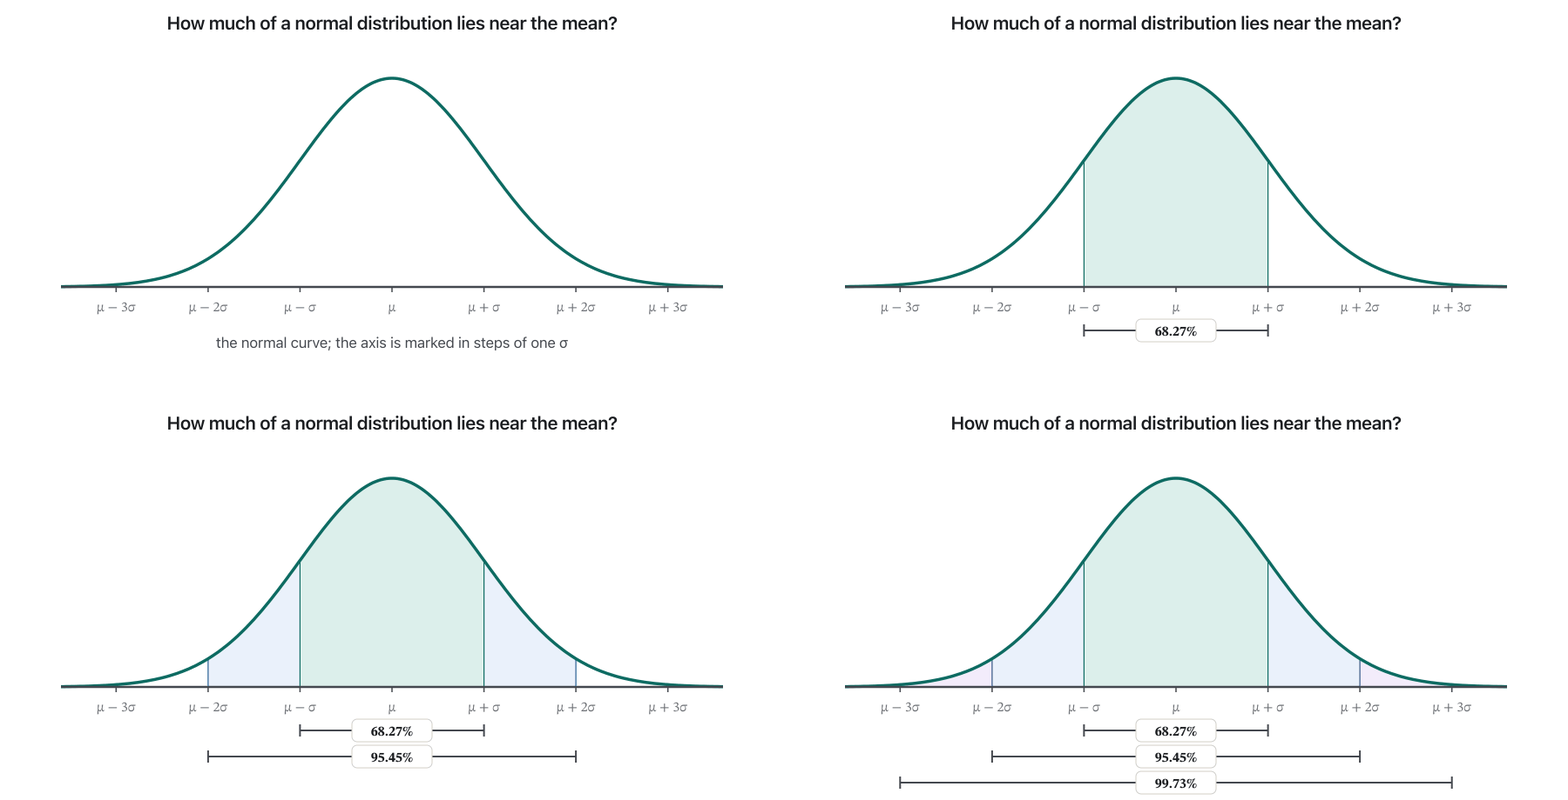
For a , about 68%, 95% and 99.7% of values lie within 1, 2 and 3 standard deviations of the mean.
بۆ ، دووریی نزیکەی 68% و 95% و 99.7%ی نرخەکان لە تێکڕاوە کەمترە لە 1 و 2 و 3 .
| Rangeناوچە | Share of valuesبەشی نرخەکان | Rice bags, کیسەی برنج، |
|---|---|---|
| 992 g to 1008 g992 تا 1008 گرام | ||
| 984 g to 1016 g984 تا 1016 گرام | ||
| 976 g to 1024 g976 تا 1024 گرام |
So a bag lighter than 976 g (more than below the mean) should almost never happen: about 1 bag in 740 (). If the shop finds many such bags, the machine is probably faulty. You met the first two numbers as a rule of thumb for bell-shaped data in What the standard deviation tells you.
کەواتە کیسەیەک کە لە 976 گرام سووکتر بێت (زیاتر لە لە خوار ) دەبێت نزیکەی هەرگیز ڕوو نەدات: نزیکەی 1 کیسە لە 740 (). گەر دوکانەکە زۆر کیسەی لەو جۆرە بدۆزێتەوە، ئامێرەکە لەوانەیە تێکچووبێت. دوو ژمارەی یەکەمت وەک یاسایەکی نزیکەیی بۆ زەنگوڵەئاسا لە ئەوەی لادانی پێوانەیی پێت دەڵێت بینی.
About 68 %, 95 % and 99.7 % of a normal distribution lie within 1, 2 and 3 standard deviations of the mean, with two practice questions.
نزیکەی 68%، 95% و 99.7%ـی تا 1، 2 و 3 لە دوورن، لەگەڵ دوو پرسیاری ڕاهێنان.
Plays 4:27-8:32: the 68-95-99.7 rule on the bell curve, then two practice questions.
لە 4:27 تا 8:32 پەخش دەبێت: لەسەر چەماوە زەنگوڵەییەکە، پاشان دوو پرسیاری ڕاهێنان.
z-scores: how unusual is a value?نمرە پێوانەییەکان: نرخێک چەند نائاساییە؟
To compare values from different normal distributions, measure each one in standard deviations from its own mean. This is its z-score:
بۆ بەراوردکردنی نرخەکان لە جیاوازەوە، هەریەکەیان بە لە خۆیەوە بپێوە. ئەمە :
: above the mean; : below it; : exactly at the mean. The second form turns a z-score back into a value.
: لە سەرووی ؛ : لە خوارییەوە؛ : ڕێک لەسەر . شێوەی دووەم دەگەڕێنێتەوە بۆ نرخ.
How many a value is above or below the mean: .
ئەوەیە کە نرخێک چەند لە سەرووی تێکڕاوە یان لە خوارییەوەیە: .
Dilan got 75 in Statistics, where the class marks are about , and 78 in Mathematics, where they are about . Which result is better compared with the class?
دیلان لە 75ی هێنا، کە نمرەکانی پۆل نزیکەی ـن و لە بیرکاریدا 78، کە نمرەکان نزیکەی ـن. کام ئەنجام بە بەراورد بە پۆلەکە باشترە؟
The Mathematics mark is lower in points but further above its class: 1.6 standard deviations against 1.5. About 94.5% of the Mathematics class is below 78, and about 93.3% of the Statistics class is below 75.
نمرەی بیرکاری بە خاڵ کەمترە بەڵام زیاتر لە سەرووی پۆلەکەیەوەیە: 1.6 بەرامبەر 1.5. نزیکەی 94.5%ی پۆلی بیرکاری لە خوار 78ـن و نزیکەی 93.3%ی پۆلی لە خوار 75ـن.
Turning every value into its z-score turns into the standard normal distribution . That is why one table, or one Python function, is enough for every normal distribution.
گۆڕینی هەموو نرخێک بۆ دەگۆڕێت بۆ . لەبەر ئەوە یەک خشتە، یان یەک Python، بۆ هەموو بەسە.
z-scores turn any normal distribution into the standard normal N(0, 1), so one table gives areas; practice questions included.
هەر دەگۆڕن بۆ ، بۆیە یەک خشتە ڕووبەرەکان دەدات؛ لەگەڵ پرسیاری ڕاهێنان.
Plays 0:15-6:39: the standard normal, z-table areas, standardisation z = (x - mu)/sigma (2:40) and three practice questions.
لە 0:15 تا 6:39 پەخش دەبێت: ، ڕووبەرەکان لە خشتەی z، پێوانەییکردن (2:40) و سێ پرسیاری ڕاهێنان.
Probabilities are areasئەگەرەکان ڕووبەرن
What share of bags weigh less than 990 g? It is the area under the curve to the left of 990. First the z-score: .
چ بەشێکی کیسەکان لە 990 گرام سووکترن؟ ئەوە ڕووبەری ژێر چەماوەکەیە لە چەپی 990. سەرەتا : .
- ڕووبەری چەپی ـیە، واتە نەخشەی دابەشبوونی کەڵەکەبوو .
- . بە هۆی .
- .
- نرخێکی تاک 0ـە، بۆیە و هەمان وەڵام دەدەن (بۆچی).
Normal probabilities in Python: no tables neededئەگەرەکانی ئاسایی لە Pythonـدا: خشتە پێویست نییە
Python's statistics.NormalDist (Python 3.8+) does all the area work. cdf(x) is the area to the left of , inv_cdf(p) goes backwards from an area to a value, and zscore(x) gives :
statistics.NormalDistـی Python (Python 3.8+) هەموو کاری ڕووبەرەکان دەکات. cdf(x) ڕووبەری چەپی ـە، inv_cdf(p) بە پێچەوانەوە لە ڕووبەرێکەوە دەگاتە نرخێک و zscore(x) دەدات:
from statistics import NormalDist

bags = NormalDist(mu=1000, sigma=8)      # weights of rice bags, in grams
print("P(X < 990)        =", round(bags.cdf(990), 4))
print("P(X > 1010)       =", round(1 - bags.cdf(1010), 4))
print("P(992 < X < 1008) =", round(bags.cdf(1008) - bags.cdf(992), 4))
print("z-score of 990 g  =", bags.zscore(990))
print("lightest 5% below =", round(bags.inv_cdf(0.05), 1), "g")

Z = NormalDist()                         # standard normal: mu = 0, sigma = 1
for k in (1, 2, 3):
print(f"within {k} sd of the mean: {Z.cdf(k) - Z.cdf(-k):.4f}")P(X < 990) = 0.1056 P(X > 1010) = 0.1056 P(992 < X < 1008) = 0.6827 z-score of 990 g = -1.25 lightest 5% below = 986.8 g within 1 sd of the mean: 0.6827 within 2 sd of the mean: 0.9545 within 3 sd of the mean: 0.9973
Explain the codeڕوونکردنەوەی کۆدەکە
- Lineدێڕی 3
A normal distribution with mean 1000 and standard deviation 8.
بە 1000 و 8.
- Lineدێڕی 4-6
Left area, right area (1 minus the left area) and the area between two values.
ڕووبەری چەپ، ڕووبەری ڕاست (1 کەم ڕووبەری چەپ) و ڕووبەری نێوان دوو نرخ.
- Lineدێڕی 8
inv_cdf(0.05)is the 5th percentile: 5% of bags weigh less than 986.8 g.inv_cdf(0.05)سەدیەکی 5ـەمە: 5%ی کیسەکان لە 986.8 گرام سووکترن.- Lineدێڕی 10-12
The standard normal checks the 68–95–99.7 rule exactly.
بە وردی دەپشکنێت.
Going backwards is useful for decisions. The shop wants to label the lightest 5% of bags as "under weight": the cut is g. The middle 95% of any normal distribution lies within , because Z.inv_cdf(0.975) is about 1.96.
گەڕانەوە بە پێچەوانەوە بۆ بڕیاردان بەسوودە. دوکانەکە دەیەوێت سووکترین 5%ی کیسەکان بە «کەمکێش» نیشان بکات: سنوورەکە گرامە. 95%ی ناوەڕاستی هەموو لە ماوەی ـدایە، چونکە Z.inv_cdf(0.975) نزیکەی 1.96ـە.
From binomial bars to the bellلە ستوونە دووڕادەییەکانەوە بۆ زەنگوڵە
The Galton board already showed it: when is large, the bars of follow the normal curve with the same mean and standard deviation, and .
پێشتر نیشانی دا: کاتێک گەورەیە، ستوونەکانی بەدوای چەماوەی ئاسایی دەکەون بە هەمان و ، و .
Example: 100 fair coin tosses, , . The exact binomial ; the normal curve between 39.5 and 60.5 gives . The rule of thumb: the approximation is good when and are both at least about 5 (some books ask for 10).
نموونە: 100 جار هەڵدانی دراوی دادپەروەر، ، . ورد ؛ چەماوەی ئاسایی لە نێوان 39.5 و 60.5دا دەدات. یاسای نزیکەیی: نزیککردنەوەکە باشە کاتێک و هەردووکیان لانیکەم نزیکەی 5 بن (هەندێک کتێب 10 داوا دەکەن).
Common mistakesهەڵە باوەکان
| Mistakeهەڵە | Why it is wrongبۆچی هەڵەیە | Correctڕاست |
|---|---|---|
| Dividing by the variance in zدابەشکردن بە لە ـدا | counts standard deviations ژمارەی دەژمێرێت | |
| Reading the curve's height as a probabilityخوێندنەوەی بەرزیی چەماوەکە وەک | For a density only areas are probabilitiesبۆ چڕی تەنها ڕووبەرەکان | |
| Using for "more than a"بەکارهێنانی بۆ «زیاتر لە a» | is the area to the left ڕووبەری چەپـە | |
| Applying the 68–95–99.7 rule to any dataبەکارهێنانی بۆ هەر | It holds only for (roughly) normal shapesتەنها بۆ شێوەی (نزیکەی) ئاسایی ڕاستە | Look at the histogram firstسەرەتا سەیری بکە |
| Thinking a normal variable has a smallest and largest valueوابزانیت گۆڕاوی ئاسایی بچووکترین و گەورەترین نرخی هەیە | The tails go on forever; far values are just rareکلکەکان کۆتاییان نییە؛ نرخە دوورەکان تەنها دەگمەنن | Use the rule: beyond is about یاساکە بەکاربهێنە: دەرەوەی نزیکەی ـە |
| Writing when the book means نووسینی کاتێک کتێبەکە مەبەستی ـە | Some books put the variance secondهەندێک کتێب لە شوێنی دووەم دادەنێن | Check which one is meant: and can be the same bagsبپشکنە مەبەست کامیانە: و دەکرێت هەمان کیسەکان بن |
Exercisesڕاهێنانەکان
Marks in a large exam are about . (a) What share is above 85? (b) What share is between 50 and 80? (c) Above which mark are the top 10%?
نمرەکانی تاقیکردنەوەیەکی گەورە نزیکەی ـن. (أ) چ بەشێک لە سەرووی 85ـن؟ (ب) چ بەشێک لە نێوان 50 و 80دان؟ (ج) باشترین 10% لە سەرووی کام نمرەوەن؟
Show answerوەڵامەکە پیشان بدە
In Python: m = NormalDist(65, 10); 1 - m.cdf(85), m.cdf(80) - m.cdf(50), m.inv_cdf(0.9).
لە Pythonـدا: m = NormalDist(65, 10)؛ 1 - m.cdf(85)، m.cdf(80) - m.cdf(50)، m.inv_cdf(0.9).
Without a computer: bags are . About what share weigh more than 1016 g?
بەبێ : کیسەکان ـن. نزیکەی چ بەشێکیان لە 1016 گرام قورسترن؟
Show answerوەڵامەکە پیشان بدە
1016 is . 95% lie within , so 5% lie outside, half on each side: about 2.5% (exactly 2.28%).
1016 دەکاتە . 95% لە ماوەی ـدان، بۆیە 5% لە دەرەوەن، نیوەی لە هەر لایەک: نزیکەی 2.5% (بە وردی 2.28%).
Aram runs 100 m in 12.4 s, where his age group is . Lana jumps 4.6 m, where her group is . Who did better relative to their group? (For running, a smaller time is better.)
ئارام 100 مەتر لە 12.4 چرکەدا ڕادەکات، کە گرووپی تەمەنەکەی ـە. لانا 4.6 مەتر باز دەدات، کە گرووپەکەی ـە. کێیان بە بەراورد بە گرووپەکەی باشتر بوو؟ (بۆ ڕاکردن کاتی کەمتر باشترە.)
Show answerوەڵامەکە پیشان بدە
Aram is 1.5 standard deviations faster than average, Lana 1.2 above average. Aram did better relative to his group.
ئارام 1.5 لە تێکڕا خێراترە، لانا 1.2 لە سەرووی تێکڕاوە. ئارام بە بەراورد بە گرووپەکەی باشتر بوو.
Toss a fair coin 100 times. Use the normal curve (with the continuity correction) to estimate .
دراوێکی دادپەروەر 100 جار هەڵبدە. بە چەماوەی ئاسایی (بە ڕاستکردنەوەی بەردەوامی) بخەمڵێنە.
Show answerوەڵامەکە پیشان بدە
Summaryپوختە
- The normal distribution is the symmetric bell curve; many measurements are close to it because many small independent effects add up (the Galton board).
- is where the peak stands (the mean, median and mode are all ) and sets the width; skewness 0 and excess kurtosis 0.
- 68.27%, 95.45% and 99.73% of values lie within 1, 2 and 3 standard deviations of the mean (, , ).
- measures a value in standard deviations and turns every normal into .
- Probabilities are areas:
NormalDist(mu, sigma).cdf,inv_cdfandzscorereplace printed tables. - For large n, .
- چەماوە هاوجێ و زەنگوڵەئاساکەیە؛ زۆر پێوانە لێی نزیکن چونکە زۆر کاریگەریی بچووکی سەربەخۆ کۆ دەبنەوە ().
- شوێنی لووتکەکەیە (، و هەموویان ـن) و پانییەکەی دیاری دەکات؛ 0ـە و ـی 0ـە.
- 68.27%، 95.45% و 99.73%ی نرخەکان لە ماوەی 1، 2 و 3 لە دەوری (، ، ).
- نرخێک بە دەپێوێت و هەموو دەکات بە .
- ڕووبەرن:
NormalDist(mu, sigma).cdf،inv_cdfوzscoreجێگای خشتە چاپکراوەکان دەگرنەوە. - بۆ ـی گەورە، .
Looking back: from data to distributionsئاوڕدانەوە: لە دراوەوە بۆ دابەشبوونەکان
This lesson closes the main path of the course. You started by describing data with means, spreads and shapes; learned to count and to compute probabilities; turned outcomes into random variables; and found that the same ideas of centre and spread return as the expected value and the variance. The normal curve is where the two halves meet: the bell that real data often follow, and the model that probability predicts.
ئەم وانەیە ڕێگای سەرەکیی کۆرسەکە دادەخات. بە وەسفکردنی بە ، بڵاوبوونەوە و شێوە دەستت پێکرد؛ فێری ژماردن و ژمێرکاریی بوویت؛ کرد بە ؛ و بینیت هەمان بیرۆکەکانی ناوەند و بڵاوبوونەوە وەک و دەگەڕێنەوە. چەماوەی ئاسایی ئەو شوێنەیە کە دوو نیوەکە بەیەک دەگەن: ئەو زەنگوڵەیەی ڕاستەقینە زۆر جار بەدوایدا دەچێت و ئەو مۆدێلەی پێشبینیی دەکات.
| Data (descriptive statistics) () | Model (probability)مۆدێل () |
|---|---|
| Relative frequency of a value نرخێک | Probability or density یان چڕی |
| Histogram | pmf stems or density curveستوونەکانی یان چەماوەی چڕی |
| Mean | Expected value |
| Variance , ، | |
| Bell-shaped histogram زەنگوڵەئاسا | Normal distribution |
The last chapter of the course, Probability at Work, uses these tools: Probability in Computing (speech recognition, predictive text, risk and random numbers) and a football prediction project.
دوایین بەشی کۆرسەکە، لە کاردا، ئەم ئامرازانە بەکار دەهێنێت: ئەگەر لە بواری کۆمپیوتەردا (، ، و ) و پرۆژەیەکی پێشبینیکردنی یاریی تۆپی پێ.
Videoڤیدیۆ
Watch a videoسەیری ڤیدیۆیەک بکە
A video that viewers liked a lot and praised in their comments, chosen for this lesson.ڤیدیۆیەک کە بینەران زۆریان پێ خۆش بووە و لە کۆمێنتەکانیاندا ستایشیان کردووە، بۆ ئەم وانەیە هەڵبژێردراوە.
What a normal curve shows: most values near the mean, fewer far away; the mean sets the centre and the standard deviation the width.
چەماوەی چی پیشان دەدات: زۆربەی نرخەکان نزیکی ، کەمتریان دوورن؛ چەقەکە دیاری دەکات و پانییەکە.
Whole video (5 minutes): the bell curve, its centre and width, and how much of the data is near the mean.
هەموو ڤیدیۆکە (5 خولەک): چەماوە زەنگوڵەییەکە، چەق و پانییەکەی، هەروەها چەند لە نزیکی .
Lesson complete!وانەکە تەواو بوو!
Well done. Review the key terms, then go on to the next lesson.دەستخۆش. سەیرێکی زاراوە سەرەکییەکان بکەرەوە، پاشان بڕۆ بۆ وانەی داهاتوو.
Key termsزاراوە سەرەکییەکان
Probability in Computing: Speech, Predictive Text and Riskبەکارهێنانی ئەگەر لە بواری کۆمپیوتەردا: ئاخاوتن، پێشبینیی دەق و مەترسی
Related lecturesوانە پەیوەندیدارەکان
- Skewness, Kurtosis and the Mean–Median–Mode Relationناهاوجێبوون، پلەی لووتکەیی و پەیوەندیی نێوان ناوەند، ناوەڕاستە و باو
- Variance and Standard Deviationلێکنەچوون و لادانی پێوانەیی
- Quartiles, Percentiles and Box Plots (Supplementary)چواریەکەکان، سەدیەکەکان و هێڵکارییە سندووقییەکان (زیادە)
- Histograms and Cumulative Frequency Graphsهیستۆگرامەکان و هێڵکارییەکانی دووبارەبوونەوەی کەڵەکەبوو
- Probability in Computing: Speech, Predictive Text and Riskبەکارهێنانی ئەگەر لە بواری کۆمپیوتەردا: ئاخاوتن، پێشبینیی دەق و مەترسی
References and further readingسەرچاوەکان و خوێندنەوەی زیاتر
- OpenStax, Introductory Statistics 2e, 6.1 The Standard Normal Distribution (N(μ, σ), z-scores, the empirical rule)
- OpenStax, Introductory Statistics 2e, 6.2 Using the Normal Distribution (areas, percentiles with technology)
- OpenStax, Introductory Statistics 2e, 4.3 Binomial Distribution
- Python documentation: statistics.NormalDist (cdf, inv_cdf, zscore, pdf)
This lecture is a first edition. The Kurdish text and terminology are waiting for review by Kurdish IT teachers.ئەم وانەیە چاپی یەکەمە. دەقە کوردییەکە و زاراوەکانی چاوەڕێی پێداچوونەوەی مامۆستایانی کوردی بواری IT ن.