Chapterبەش 2 · Lectureوانە 2.10
Quartiles, Percentiles and Box Plots (Supplementary)چواریەکەکان، سەدیەکەکان و هێڵکارییە سندووقییەکان (زیادە)
A supplementary lesson: quartiles and percentiles of sorted data, the interquartile range and the outlier rule, the five-number summary and box plots — built step by step and used to compare two groups — with grouped quartiles and Python's statistics.quantiles (and why its answers can differ).
وانەیەکی زیادە: و ڕیزکراو، و یاسای بۆ ، و — هەنگاو بە هەنگاو دروست دەکرێن و بۆ بەراوردی دوو گرووپ بەکار دێن — لەگەڵ و statistics.quantilesـی Python (و بۆچی وەڵامەکانی دەکرێت جیاواز بن).
What you will learnچی فێر دەبیت
- Find the quartiles and percentiles of a data set and explain what a percentile means.
- Compute the IQR and use the rule to spot outliers.
- Draw and read a box plot, and compare groups with box plots on one scale.
- Use
statistics.quantilesin Python and explain why quartile methods differ.
- و کۆمەڵە بدۆزیتەوە و ڕوونی بکەیتەوە واتای چییە.
- بژمێریت و یاسای بۆ ناسینەوەی بەکار بهێنیت.
- بکێشیت و بیخوێنیتەوە و گرووپەکان بە لەسەر یەک پێوانە بەراورد بکەیت.
statistics.quantilesلە Pythonـدا بەکار بهێنیت و ڕوونی بکەیتەوە بۆچی ڕێگاکانی جیاوازن.
Cutting the data into quartersبڕینی دراوەکە بۆ چوار بەش
The median cuts sorted data into two halves. Cut each half again and you get quartiles: three values that split the data into four parts with about a quarter of the values in each. In the same way, percentiles cut the data into a hundred parts.
ناوەڕاستە ڕیزکراو دەکاتە دوو نیوە. هەر نیوەیەک دووبارە ببڕە، دەدۆزیتەوە: سێ نرخ کە دەکەنە چوار بەش و لە هەر بەشێکدا نزیکەی چارەکێکی نرخەکان هەیە. بە هەمان شێوە، دەکەنە سەد بەش.
One of three values that cut sorted data into four equal parts: (25%), (the ) and (75%).
یەکێکە لەو سێ نرخەی کە دراوەی ڕیزکراو دەکەن بە چوار بەشی یەکسان: (25%)، () و (75%).
About 25% of the values lie below , 50% below the median and 75% below .
نزیکەی 25%ـی نرخەکان لە خوار ـەوەن، 50% لە خوار و 75% لە خوار .
Finding the quartiles by handدۆزینەوەی چواریەکەکان بە دەست
- Sortڕیز بکە
Write the data from smallest to largest.
لە بچووکەوە بۆ گەورە بنووسە.
- Find the medianناوەڕاستە بدۆزەرەوە
This is . It splits the list into a lower half and an upper half. When is odd, the median itself belongs to neither half.
ئەمە ـە. لیستەکە دەکاتە نیوەی خوارەوە و نیوەی سەرەوە. کاتێک تاکە، خودی سەر بە هیچ نیوەیەک نییە.
- Median of each halfناوەڕاستەی هەر نیوەیەک
is the median of the lower half and the median of the upper half.
نیوەی خوارەوەیە و نیوەی سەرەوە.
Example: the eleven values 2, 3, 4, 5, 5, 6, 7, 10, 13, 14, 19 (the data of the mean deviation lesson). The median is the 6th value, 6. The lower half 2, 3, 4, 5, 5 has median 4, and the upper half 7, 10, 13, 14, 19 has median 13:
نموونە: یازدە نرخەکەی 2، 3، 4، 5، 5، 6، 7، 10، 13، 14، 19 ( وانەی لادانی نێوانەیی). نرخی شەشەمە، 6. نیوەی خوارەوە 2، 3، 4، 5، 5 4ـە و نیوەی سەرەوە 7، 10، 13، 14، 19 13ـە:
Finding the quartiles by handدۆزینەوەی چواریەکەکان بە دەست
When is evenکاتێک جووتە
Add a twelfth value, 40: 2, 3, 4, 5, 5, 6, 7, 10, 13, 14, 19, 40. Now the median is the mean of the 6th and 7th values, and each half has six values:
نرخێکی دوازدەیەم، 40، زیاد بکە: 2، 3، 4، 5، 5، 6، 7، 10، 13، 14، 19، 40. ئێستا نرخی شەشەم و حەوتەمە و هەر نیوەیەک شەش نرخی هەیە:
is the median of the lower half 2, 3, 4, 5, 5, 6, and is the median of the upper half 7, 10, 13, 14, 19, 40.
نیوەی خوارەوەیە (2، 3، 4، 5، 5، 6) و نیوەی سەرەوە (7، 10، 13، 14، 19، 40).
The extreme value 40 moved the median only from 6 to 6.5 and the quartiles by half a unit. Quartiles, like the median, are hardly disturbed by one extreme value.
نرخە دوورەکەی 40 تەنها لە 6ـەوە بردە 6.5 و نیو یەکە جووڵان. ، وەک ، بە یەک نرخی زۆر دوور بە زەحمەت تێک دەچن.
Percentilesسەدیەکەکان
A value below which a given percentage of the data lies: the 90th percentile is higher than 90% of the values.
نرخێکە کە ڕێژەیەکی دیاریکراوی دراوەکە لە خوارییەوەیە: سەدیەکی 90 لە 90%ی نرخەکان بەرزترە.
To find the -th percentile of sorted values, first find its position:
بۆ دۆزینەوەی ـەمی نرخی ڕیزکراو، سەرەتا شوێنەکەی بدۆزەرەوە:
If is a whole number, the percentile is the value in position . If not, take the mean of the values just below and just above position .
ئەگەر بێت، ئەو نرخەیە کە لە شوێنی ـدایە. ئەگەر نا، ئەو دوو نرخەی ڕێک لە خوار و سەرووی شوێنی ـەوەن وەربگرە.
The 60 values of Example (1), sorted: 60, 65, 68, 72, 76, 78, 80, 82, 88, 90, 93, 95, 96, 98, 98, 101, 103, 104, 109, 110, 111, 111, 113, 114, 116, 116, 116, 118, 119, 119, 120, 120, 120, 121, 122, 122, 123, 125, 125, 126, 126, 126, 126, 130, 131, 132, 136, 136, 136, 137, 139, 142, 142, 150, 150, 154, 156, 156, 157, 164.
60 نرخەکەی نموونەی (1)، ڕیزکراو: 60، 65، 68، 72، 76، 78، 80، 82، 88، 90، 93، 95، 96، 98، 98، 101، 103، 104، 109، 110، 111، 111، 113، 114، 116، 116، 116، 118، 119، 119، 120، 120، 120، 121، 122، 122، 123، 125، 125، 126، 126، 126، 126، 130، 131، 132، 136، 136، 136، 137، 139، 142، 142، 150، 150، 154، 156، 156، 157، 164.
- 25th percentileسەدیەکی 25
: between the 15th (98) and 16th (101) values, so — the same as .
: لە نێوان نرخی 15ـەم (98) و 16ـەم (101)، بۆیە — هەمان .
- 90th percentileسەدیەکی 90
: between the 54th (150) and 55th (150) values, so . Only 5 of the 60 values (about 8%) are above 150.
: لە نێوان نرخی 54ـەم (150) و 55ـەم (150)، بۆیە . تەنها 5 نرخ لە 60 نرخەکە (نزیکەی 8%) لە سەرووی 150ـن.
What quantiles and percentiles are: values that cut sorted data into equal-sized groups, and why tools may compute them a little differently.
quantiles و چین: ئەو نرخانەی ڕیزکراو دەکەن بە چەند گرووپێکی هاوقەبارە، هەروەها بۆچی ئامرازەکان کەمێک بە جیاوازی دەیانژمێرن.
Whole video: what a percentile (quantile) is
هەموو ڤیدیۆکە: (quantile) چییە.
Percentilesسەدیەکەکان
Which percentile is a value?نرخێک لە کام سەدیەکدایە؟
Which percentile is a given value? Count the values below it () and equal to it (): . For 136: 46 values are below and 3 are equal, so : 136 is at about the 79th percentile.
نرخێکی دیاریکراو لە کام ؟ ئەو نرخانە بژمێرە کە لە خوارییەوەن () و یەکسانن پێی (): . بۆ 136: 46 نرخ لە خوارییەوەن و 3 یەکسانن، بۆیە : 136 نزیکەی لە 79دایە.
The interquartile range and outliersمەودای چواریەکی و بەها پەڕگرەکان
The distance between the third and first : . It is the spread of the middle half of the data.
دووریی نێوان سێیەم و یەکەمە: . پەرتبوونی نیوەی ناوەڕاستی دراوەکە پیشان دەدات.
For the eleven values: . The middle half of the data lies within a stretch 9 units long.
بۆ یازدە نرخەکە: . نیوەی ناوەڕاستی لە ناو بەشێکی هێڵی ژمارەکاندایە کە درێژییەکەی 9 یەکەیە.
The range (largest − smallest) depends on the two most extreme values only: adding 40 makes it jump from 17 to 38. The IQR ignores the top and bottom quarters, so it stays about the same (9 by hand). That makes the IQR a good ruler for spotting values that are unusually far away.
مەودا (گەورەترین − بچووکترین) تەنها بەندە بە دوو دوورترین نرخ: زیادکردنی 40 لە 17ـەوە دەیگەیەنێتە 38. چارەکی سەرەوە و خوارەوە پشتگوێ دەخات، بۆیە نزیکەی وەک خۆی دەمێنێتەوە (9 بە دەست). ئەمە دەکاتە پێوەرێکی باش بۆ دۆزینەوەی ئەو نرخانەی بە شێوەیەکی نائاسایی دوورن.
Find Q1, the median and Q3, draw a box plot, work out the IQR, then use 1.5 × IQR fences to spot outliers.
، و بدۆزەرەوە، بکێشە، بژمێرە، پاشان بە سنوورەکانی بدۆزەرەوە.
Whole video: IQR, a box plot and the 1.5 × IQR rule for outliers
هەموو ڤیدیۆکە: ، و یاسای بۆ .
The interquartile range and outliersمەودای چواریەکی و بەها پەڕگرەکان
The rule for outliersیاسای بۆ بەها پەڕگرەکان
The usual rule calls a value an outlier when it lies more than outside the box:
یاسا باوەکە بە نرخێک دەڵێت کاتێک زیاتر لە لە دەرەوەی سندووقەکە بێت:
A value is an outlier if either of these two inequalities is true.
نرخی ئەگەر یەکێک لەم دوو ڕاست بێت.
With 40 added: , , . The limits are and . 40 is above 27, so 40 is an outlier. Every other value lies inside the limits.
دوای زیادکردنی 40: ، ، . سنوورەکان و ن. 40 لە سەرووی 27ـەوەیە، بۆیە 40 . هەموو نرخەکانی تر لە ناو سنوورەکاندان.
The five-number summary and the box plotکورتەی پێنج ژمارەیی و هێڵکاریی سندووقی
Minimum, , , and maximum — the five numbers drawn in a .
کەمترین نرخ و و و و زۆرترین نرخ — ئەو پێنج ژمارەیەی لە دەکێشرێن.
For the eleven values the five-number summary is 2, 4, 6, 13, 19. A box plot draws exactly these five numbers on a scale: a box from to , a line inside it at the median, and two whiskers out to the smallest and largest values.
بۆ یازدە نرخەکە 2، 4، 6، 13، 19ـە. ڕێک ئەم پێنج ژمارەیە لەسەر پێوانەیەک دەکێشێت: سندووقێک لە ـەوە بۆ ، هێڵێک لە ناویدا لەسەر و دوو تا بچووکترین و گەورەترین نرخ.
A of the : a box from to with a line at the median, and whiskers out to the smallest and largest values that are not .
: سندووقێک لە تا بە هێڵێک لە ناوەڕاستەکەدا و دوو سمێڵ تا بچووکترین و گەورەترین ئەو نرخانەی نین.
The five-number summary and the box plotکورتەی پێنج ژمارەیی و هێڵکاریی سندووقی
Building a box plot, step by stepدروستکردنی هێڵکارییەکی سندووقی، هەنگاو بە هەنگاو
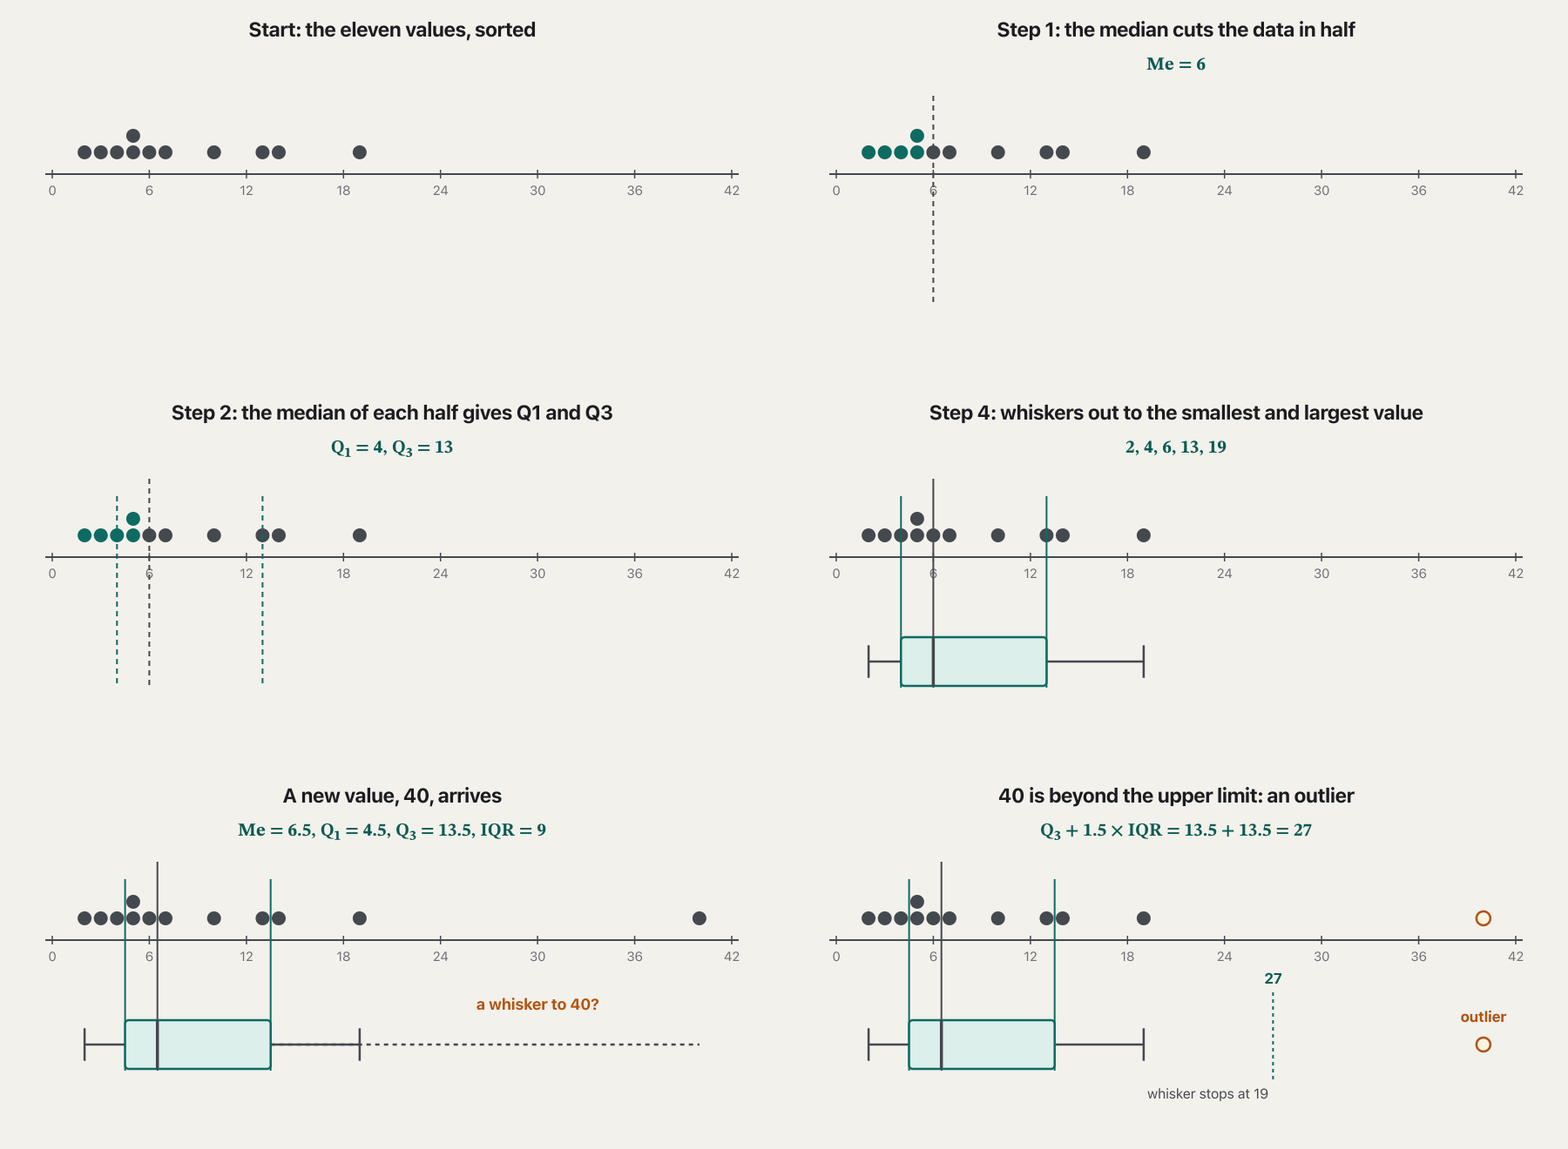
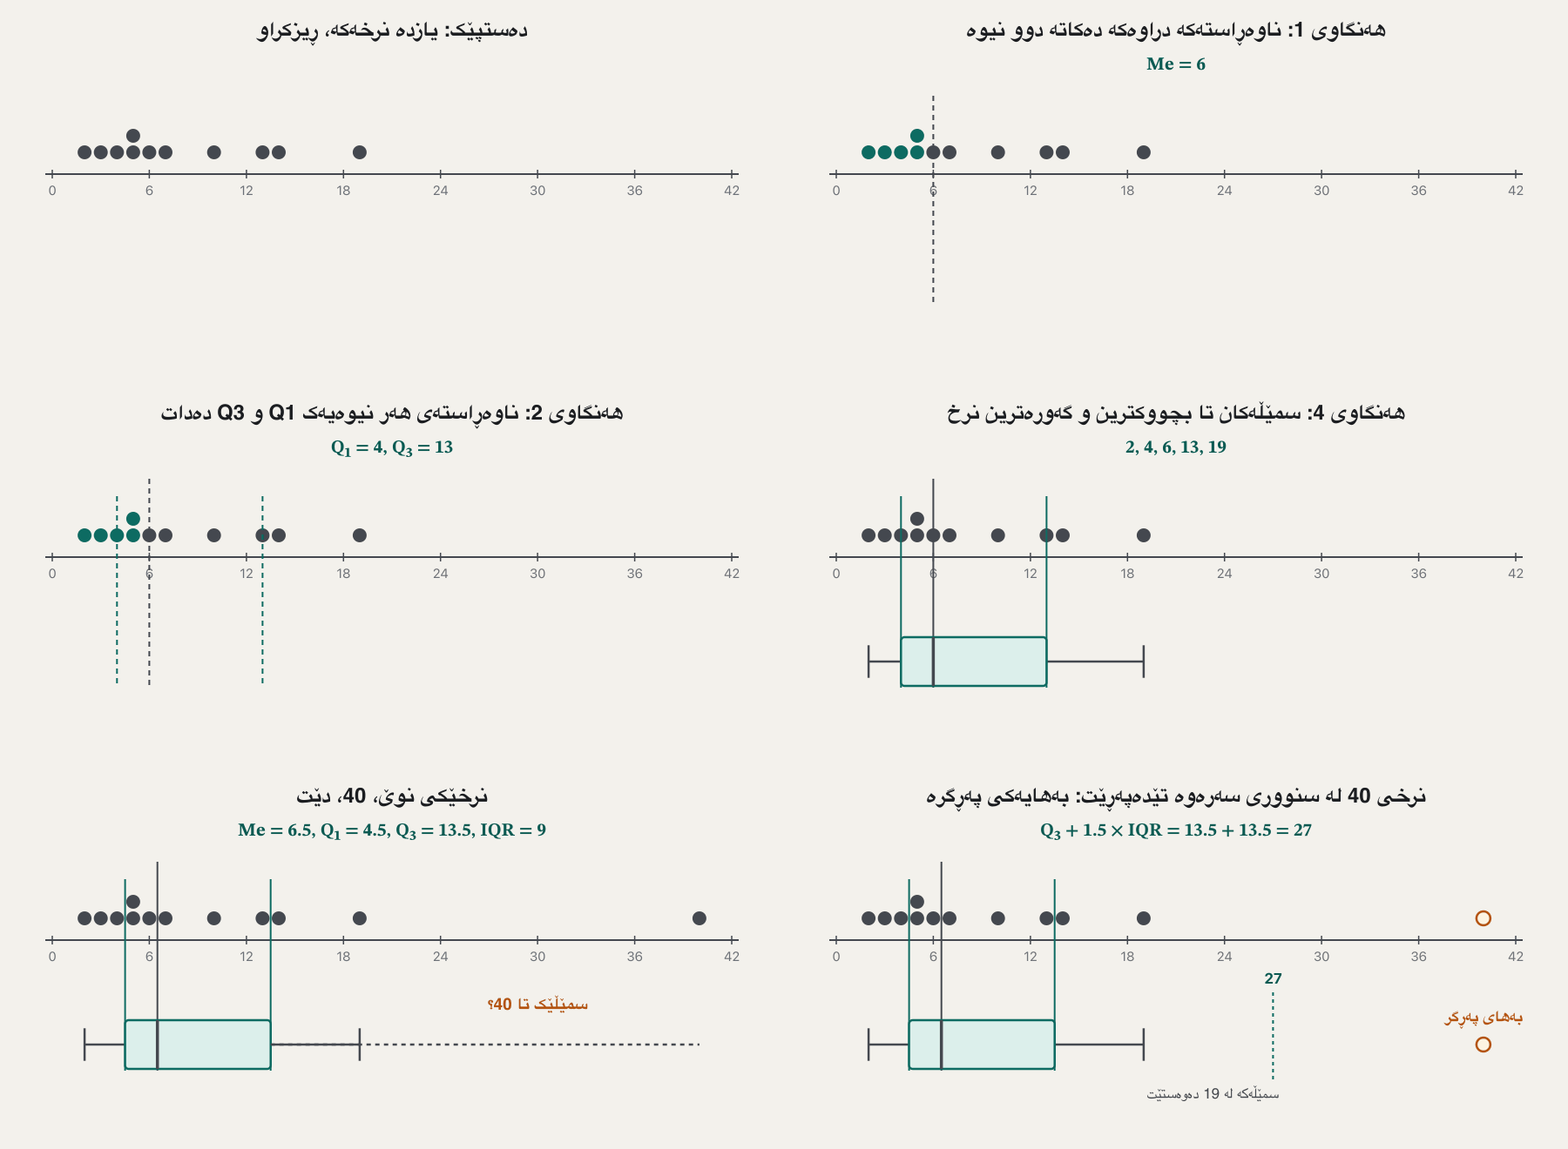
- Draw a scaleپێوانەیەک بکێشە
A number line that covers all the data.
هێڵێکی ژمارەیی کە هەموو بگرێتەوە.
- The boxسندووقەکە
From to , with a line at the median.
لە ـەوە بۆ ، بە هێڵێک لەسەر .
- Check for outliersبەها پەڕگرەکان بپشکنە
Compute and .
و بژمێرە.
- The whiskersسمێڵەکان
From the box to the smallest and largest values that are not outliers.
لە سندووقەکەوە بۆ بچووکترین و گەورەترین نرخ کە نین.
- The outliersبەها پەڕگرەکان
Draw each one as a separate point.
هەر یەکێکیان وەک خاڵێکی جیا بکێشە.
One of the two lines of a that run from the box out to the smallest and the largest value that is not an .
یەکێکە لەو دوو هێڵەی کە لە سندووقەکەوە دەڕۆن بۆ بچووکترین و گەورەترین نرخ کە نییە.
The five-number summary and the box plotکورتەی پێنج ژمارەیی و هێڵکاریی سندووقی
Reading a box plotخوێندنەوەی هێڵکارییەکی سندووقی
- Centre — the median line.
- Spread — the width of the box (the IQR) and the length of the whiskers.
- Shape — a median close to with a long right whisker means the data have a long tail to the right (as in our eleven values).
- Unusual values — the separate points beyond the whiskers.
- ناوەڕاست — هێڵی .
- — پانیی سندووقەکە () و درێژیی .
- شێوە — ئەگەر نزیکی بێت و لای ڕاست درێژ بێت، واتە کلکێکی درێژی بەلای ڕاستدا هەیە (وەک یازدە نرخەکەی ئێمە).
- نرخە نائاساییەکان — خاڵە جیاکان لە دوای .
Two special cases: if many values are equal, the median can sit on the edge of the box, and a whisker can have length zero (when the minimum equals ). Each of the four parts still holds about a quarter of the values; a short part just means those values are packed close together.
دوو حاڵەتی تایبەت: ئەگەر زۆر نرخ یەکسان بن، دەکرێت لەسەر لێواری سندووقەکە بێت و دەکرێت درێژییەکەی سفر بێت (کاتێک کەمترین نرخ یەکسانە بە ). هەر یەک لە چوار بەشەکە هێشتا نزیکەی چارەکێکی نرخەکان دەگرێتەخۆ؛ بەشێکی کورت تەنها واتای ئەوەیە کە ئەو نرخانە زۆر لە یەکەوە نزیکن.
Comparing groups with box plotsبەراوردکردنی گرووپەکان بە هێڵکارییە سندووقییەکان
Box plots are most useful side by side. Two sections of the same course took a quiz out of 20 (example data): morning 5, 7, 8, 9, 11, 12, 13, 15, 16, 18, 19 and evening 2, 10, 11, 11, 12, 12, 13, 13, 14, 14, 15.
لە هەموو کاتێک بەسوودترن کاتێک لە تەنیشت یەکەوە دادەنرێن. دوو بەشی هەمان وانە تاقیکردنەوەیەکیان لە 20 کرد ( نموونەیی): بەیانیان 5، 7، 8، 9، 11، 12، 13، 15، 16، 18، 19 و ئێواران 2، 10، 11، 11، 12، 12، 13، 13، 14، 14، 15.
| Measureپێوەر | Morningبەیانیان | Eveningئێواران |
|---|---|---|
| Five-number summary | 5, 8, 12, 16, 19 | 2, 11, 12, 14, 15 |
| 8 | 3 | |
| Limits ()سنوورەکان () | ||
| Outliers | noneنییە | 2 |
| Mean | 12.09 | 11.55 |
Both sections have the same median, 12, so a typical student did equally well. But the evening marks are packed together (IQR 3) while the morning marks are spread out (IQR 8). One evening student scored 2 — an outlier worth a question (absent? ill?). Notice how that single 2 pulls the evening mean below the morning mean although the medians are equal.
هەردوو بەش هەمان هەیە، 12، بۆیە قوتابییەکی ئاسایی هەمان ئاستی هەبوو. بەڵام نمرەکانی ئێواران لە یەکەوە نزیکن (IQR 3) و هی بەیانیان پەرتن (IQR 8). قوتابییەکی ئێواران 2ـی هێنا — کە شایەنی پرسیارە (ئامادە نەبوو؟ نەخۆش بوو؟). سەرنج بدە چۆن ئەو تاکە 2ـیە ئێواران دەباتە خوار بەیانیان، هەرچەندە یەکسانن.
Quartiles of grouped dataچواریەکەکانی دراوەی پۆلێنکراو
For a frequency table, use the grouped median formula with or in place of , inside the class where the cumulative frequency first reaches that number:
بۆ ، یاسای ناوەڕاستەی پۆلێنکراو بەکار بهێنە بە یان لە جیاتی ، لە ناو ئەو کە یەکەم جار دەگاتە ئەو ژمارەیە:
Example (15) of the median lesson (60–63, …, 72–75 with frequencies 5, 18, 42, 27, 8; cumulative 5, 23, 65, 92, 100): falls in 66–69, so ; falls in 69–72, so . The IQR is about 3.97.
نموونەی (15)ی وانەی ناوەڕاستە (60–63، …، 72–75 بە 5، 18، 42، 27، 8؛ 5، 23، 65، 92، 100): دەکەوێتە 66–69، بۆیە ؛ دەکەوێتە 69–72، بۆیە . نزیکەی 3.97ـە.
Quartiles in Python — and why methods differچواریەکەکان لە Pythonـدا — و بۆچی ڕێگاکان جیاوازن
statistics.quantiles(data, n=4) returns the three quartiles; n=10 gives deciles and n=100 percentiles. It has two methods: 'exclusive' (the default) and 'inclusive'. Both interpolate between neighbouring values, so their answers can differ a little from the hand method.
statistics.quantiles(data, n=4) سێ دەگەڕێنێتەوە؛ n=10 دەیەکەکان و n=100 دەدات. دوو ڕێگای هەیە: 'exclusive' (بنەڕەتی) و 'inclusive'. هەردووکیان لە نێوان نرخە دراوسێکاندا خەمڵاندن دەکەن، بۆیە وەڵامەکانیان دەکرێت کەمێک لە ڕێگای دەستی جیاواز بن.
import statistics as st

data = [2, 3, 4, 5, 5, 6, 7, 10, 13, 14, 19]
print(st.quantiles(data, n=4))                      # 'exclusive' (default)
print(st.quantiles(data, n=4, method="inclusive"))

data.append(40)
q1, q2, q3 = st.quantiles(data, n=4)
iqr = q3 - q1
low, high = q1 - 1.5 * iqr, q3 + 1.5 * iqr
print(q1, q2, q3, iqr)
print(low, high)
print([x for x in data if x < low or x > high]) # outliers[4.0, 6.0, 13.0] [4.5, 6.0, 11.5] 4.25 6.5 13.75 9.5 -10.0 28.0 [40]
Explain the codeڕوونکردنەوەی کۆدەکە
- Lineدێڕی 4-5
For the eleven values, 'exclusive' agrees with the hand method (4, 6, 13); 'inclusive' gives 4.5 and 11.5.
بۆ یازدە نرخەکە، 'exclusive' لەگەڵ ڕێگای دەستی یەک دەگرێتەوە (4، 6، 13)؛ 'inclusive' 4.5 و 11.5 دەدات.
- Lineدێڕی 7-12
With 40 added, Python gives and (hand: 4.5 and 13.5), yet 40 is still the only outlier.
دوای زیادکردنی 40، Python و دەدات (بە دەست: 4.5 و 13.5)، بەڵام هێشتا 40 تاکە .
| Data | By hand (median of halves)بە دەست ( نیوەکان) | Python 'exclusive'Python (ڕێگای 'exclusive') | Python 'inclusive'Python (ڕێگای 'inclusive') |
|---|---|---|---|
| 11 values11 نرخ | 4, 6, 13 | 4, 6, 13 | 4.5, 6, 11.5 |
| 12 values (with 40)12 نرخ (لەگەڵ 40) | 4.5, 6.5, 13.5 | 4.25, 6.5, 13.75 | 4.75, 6.5, 13.25 |
Common mistakesهەڵە باوەکان
| Mistakeهەڵە | Fixچارەسەر |
|---|---|
| Finding quartiles in unsorted dataدۆزینەوەی لە ڕیزنەکراودا | Sort first, as for the medianسەرەتا ڕیز بکە، وەک بۆ |
| Reading “90th percentile” as “90%”خوێندنەوەی « 90» وەک «90%» | It is a position among the data, not a scoreشوێنێکە لە نێوان ، نەک نمرە |
| — a distance, not a centre — دوورییە، نەک ناوەڕاست | |
| Whiskers drawn out to an outlierکێشانی تا | Stop at the last value inside the limits; draw the outlier as a pointلە دوایین نرخی ناو سنوورەکان بوەستە؛ وەک خاڵ بکێشە |
| Deleting outliers automaticallyسڕینەوەی بە شێوەی خۆکار | Check them first: mistake or real value?سەرەتا بیانپشکنە: هەڵەیە یان نرخی ڕاستەقینە؟ |
| Comparing box plots drawn on different scalesبەراوردکردنی کە لەسەر پێوانەی جیاواز کێشراون | Put them on one common scaleلەسەر یەک پێوانەی هاوبەش دایانبنێ |
Exercisesڕاهێنانەکان
Find , the median, and the IQR of 31, 25, 40, 28, 35, 22, 30, 45, 27. Are there outliers?
، ، و IQR بۆ 31، 25، 40، 28، 35، 22، 30، 45، 27 بدۆزەرەوە. هەیە؟
Show answerوەڵامەکە پیشان بدە
Sorted: 22, 25, 27, 28, 30, 31, 35, 40, 45. Median 30; lower half 22, 25, 27, 28 → ; upper half 31, 35, 40, 45 → ; . Limits and : no outliers.
ڕیزکراو: 22، 25، 27، 28، 30، 31، 35، 40، 45. 30؛ نیوەی خوارەوە 22، 25، 27، 28 ← ؛ نیوەی سەرەوە 31، 35، 40، 45 ← ؛ . سنوورەکان و ن: نییە.
Use the 60 sorted values of Example (1) (in the Percentiles section) to find the five-number summary and check for outliers. Describe the shape.
60 نرخە ڕیزکراوەکەی نموونەی (1) (لە بەشی ) بەکار بهێنە بۆ دۆزینەوەی و پشکنینی . شێوەکەی وەسف بکە.
Hintئاماژە
: the median is the mean of the 30th and 31st values; each half has 30 values.
: نرخی 30ـەم و 31ـەمە؛ هەر نیوەیەک 30 نرخی هەیە.
Show answerوەڵامەکە پیشان بدە
Min 60; ; median ; ; max 164. ; limits and : no outliers. The median is closer to than to and the left whisker () is longer: the data have a longer tail to the left.
کەمترین 60؛ ؛ ؛ ؛ زۆرترین 164. ؛ سنوورەکان و ن: نییە. لە ـەوە نزیکترە تا لە و چەپ () درێژترە: کلکێکی درێژتری بەلای چەپدا هەیە.
In the eleven values 2, 3, 4, 5, 5, 6, 7, 10, 13, 14, 19, at which percentile is the value 10?
لە یازدە نرخەکەی 2، 3، 4، 5، 5، 6، 7، 10، 13، 14، 19ـدا، نرخی 10 لە کام ؟
Show answerوەڵامەکە پیشان بدە
7 values are below 10 and 1 is equal: , so 10 is at about the 68th percentile.
7 نرخ لە خوار 10ـەوەن و 1 یەکسانە: ، بۆیە 10 نزیکەی لە 68دایە.
Look at the two sections' box plots. Give two facts that the means alone (12.09 and 11.55) would hide.
سەیری دوو بەشەکە بکە. دوو ڕاستی بڵێ کە بە تەنها (12.09 و 11.55) دەیانشارنەوە.
Show answerوەڵامەکە پیشان بدە
- The medians are equal (12): the typical student did equally well in both sections.
- The evening marks are much less spread (IQR 3 vs 8), and the low evening mean comes from one outlier, 2.
- یەکسانن (12): قوتابیی ئاسایی لە هەردوو بەشدا هەمان ئاستی هەبوو.
- نمرەکانی ئێواران زۆر کەمتر پەرتن (IQR 3 بەرامبەر 8) و نزمی ئێواران لە یەک هاتووە، 2.
Exercisesڕاهێنانەکان
Exercise: a percentile function in Pythonڕاهێنان: کردارێک بۆ سەدیەک لە Pythonـدا
A school keeps the marks of an aptitude test in a list. Write a function percentile(marks, x) that uses the nearest-rank method: sort a copy of the list, find the rank (round up to a whole number) and return the mark at that rank. Test it with and on these 20 marks: 55, 72, 64, 90, 48, 81, 77, 69, 93, 58, 66, 85, 74, 61, 88, 79, 52, 70, 83, 96. Then compare with statistics.quantiles(marks, n=100).
قوتابخانەیەک نمرەکانی تاقیکردنەوەیەکی توانا لە لیستێکدا هەڵدەگرێت. بنووسە بە ناوی percentile(marks, x) کە ڕێگای نزیکترین پلە بەکار دەهێنێت: کۆپییەکی لیستەکە ڕیز بکە، پلەی بدۆزەرەوە (بەرەو سەرەوە بۆ نزیکی بکەرەوە) و ئەو نمرەیە بگەڕێنەوە کە لەو پلەیەدایە. بە و لەسەر ئەم 20 نمرەیە تاقیی بکەرەوە: 55، 72، 64، 90، 48، 81، 77، 69، 93، 58، 66، 85، 74، 61، 88، 79، 52، 70، 83، 96. پاشان بەراوردی بکە بە statistics.quantiles(marks, n=100).
Hintئاماژە
Use math.ceil() to round up. Python has no math.round() (the built-in round() rounds to the nearest whole number, which is a different rule). Remember that list positions start at 0.
بۆ نزیککردنەوە بەرەو سەرەوە math.ceil() بەکار بهێنە. Python هیچ math.round()ـێکی نییە (round()ـی ناوخۆیی بۆ نزیکترین نزیک دەکاتەوە، کە یاسایەکی ترە). لەبیرت بێت کە شوێنەکانی لیست لە 0ـەوە دەست پێ دەکەن.
Show answerوەڵامەکە پیشان بدە
import math
import statistics as st

def percentile(marks, x):
    """Nearest-rank x-th percentile, 0 < x <= 100."""
    data = sorted(marks)                  # a sorted copy; marks is unchanged
    rank = math.ceil(x * len(data) / 100)  # round UP to a whole rank
    return data[rank - 1]                 # rank 1 is index 0

marks = [55, 72, 64, 90, 48, 81, 77, 69, 93, 58,
         66, 85, 74, 61, 88, 79, 52, 70, 83, 96]
print(percentile(marks, 90), percentile(marks, 25))

p = st.quantiles(marks, n=100)           # 99 cut points: p[0] is P1
print(round(p[89], 2), round(p[24], 2)) # P90 and P2590 61 92.7 61.75
Explain the codeڕوونکردنەوەی کۆدەکە
- Lineدێڕی 6
For 20 marks and : , so the 18th mark in order. Multiplying before dividing keeps the rank exact.
بۆ 20 نمرە و : ، واتە هەژدەیەمین نمرە بە ڕیز. لێکدان پێش دابەشکردن پلەکە ورد دەهێڵێتەوە.
- Lineدێڕی 14-15
quantiles()interpolates between neighbouring marks (the 'exclusive' method), so it gives 92.7 and 61.75.quantiles()لە نێوان نمرە دراوسێکاندا خەمڵاندن دەکات (ڕێگای 'exclusive')، بۆیە 92.7 و 61.75 دەدات.
Sorted, the marks are 48, 52, …, 88, 90, 93, 96. Nearest rank: the 18th mark is 90 and the 5th mark is 61, so 18 of the 20 students (90%) scored 90 or less. The position rule of this lesson, , gives , and Python gives 92.7. All three are accepted methods; say which one you used. With 120 students the nearest rank for the 90th percentile would be : the 108th mark in order.
بە ڕیزکراوی نمرەکان 48، 52، …، 88، 90، 93، 96ن. نزیکترین پلە: نمرەی هەژدەیەم 90ـە و نمرەی پێنجەم 61ـە، کەواتە 18 لە 20 قوتابییەکە (90%) 90 یان کەمتریان هێناوە. یاسای شوێنی ئەم وانەیە، ، دەدات و Python 92.7 دەدات. هەر سێکیان ڕێگای پەسەندکراون؛ بڵێ کامیانت بەکار هێناوە. ئەگەر 120 قوتابی هەبوایە، نزیکترین پلە بۆ 90 دەبوو بە : نمرەی 108ـەم بە ڕیز.
Summaryپوختە
- Quartiles cut sorted data into four parts; by hand, and are the medians of the lower and upper halves.
- The -th percentile is at position ; a percentile is a position, not a percentage score.
- measures the spread of the middle half; outliers lie beyond or .
- A box plot draws the five-number summary; whiskers stop at the last non-outlier, outliers are separate points.
- Different methods (hand, Python 'exclusive', 'inclusive') can give slightly different quartiles.
- ڕیزکراو دەکەنە چوار بەش؛ بە دەست، و نیوەی خوارەوە و سەرەوەن.
- ـەم لە شوێنی ـدایە؛ شوێنە، نەک نمرەی سەدی.
- نیوەی ناوەڕاست دەپێوێت؛ لە دەرەوەی یان ـن.
- دەکێشێت؛ لە دوایین نرخدا دەوەستن کە نییە و خاڵی جیان.
- ڕێگا جیاوازەکان (دەستی، Python 'exclusive'، 'inclusive') دەکرێت کەمێک جیاواز بدەن.
Why is the IQR a better measure of spread than the range when there is an outlier?بۆچی کاتێک بەهای پەڕگر هەیە مەودای چواریەکی پێوەرێکی باشترە بۆ پەرتبوون لە مەودا؟
The range uses only the two extreme values, so one outlier changes it a lot; the IQR ignores the outer quarters.
تەنها دوو نرخە دوورەکە بەکار دەهێنێت، بۆیە یەک زۆری دەگۆڕێت؛ چارەکە دەرەکییەکان پشتگوێ دەخات.
What five numbers does a box plot show?هێڵکاریی سندووقی کام پێنج ژمارە پیشان دەدات؟
Minimum, , median, , maximum (with outliers drawn separately).
کەمترین، ، ، ، زۆرترین (و بە جیا دەکێشرێن).
Videoڤیدیۆ
Watch a videoسەیری ڤیدیۆیەک بکە
A video that viewers liked a lot and praised in their comments, chosen for this lesson.ڤیدیۆیەک کە بینەران زۆریان پێ خۆش بووە و لە کۆمێنتەکانیاندا ستایشیان کردووە، بۆ ئەم وانەیە هەڵبژێردراوە.
Quartiles, deciles and percentiles cut sorted data into equal parts; the five-number summary; why computer programs give slightly different quartiles.
، دەیەکەکان (deciles) و ڕیزکراو دابەشی چەند بەشێکی یەکسان دەکەن؛ ؛ هەروەها بۆچی کەمێک جیاواز دەدەن.
Whole video: quartiles, percentiles, the five-number summary and why methods differ
هەموو ڤیدیۆکە: ، ، و بۆچی ڕێگاکان جیاوازن.
Lesson complete!وانەکە تەواو بوو!
Well done. Review the key terms, then go on to the next lesson.دەستخۆش. سەیرێکی زاراوە سەرەکییەکان بکەرەوە، پاشان بڕۆ بۆ وانەی داهاتوو.
Key termsزاراوە سەرەکییەکان
Practice: One Data Set from Table to Averagesڕاهێنان: یەک کۆمەڵەدراوە لە خشتەوە بۆ پێوەرەکانی ڕووکردنە چەق
Related lecturesوانە پەیوەندیدارەکان
- Measuring Spread: Range and Mean Deviationپێوانی پەرتبوون: مەودا و لادانی نێوانەیی
- Variance and Standard Deviationلێکنەچوون و لادانی پێوانەیی
- Skewness, Kurtosis and the Mean–Median–Mode Relationناهاوجێبوون، پلەی لووتکەیی و پەیوەندیی نێوان ناوەند، ناوەڕاستە و باو
- Grouping Data: Frequency Tablesپۆلێنکردنی دراوە: خشتەکانی دووبارەبوونەوە
References and further readingسەرچاوەکان و خوێندنەوەی زیاتر
- OpenStax, Introductory Statistics 2e, 2.3 Measures of the Location of the Data (quartiles, percentiles, IQR, outliers)
- OpenStax, Introductory Statistics 2e, 2.4 Box Plots
- Python documentation: statistics.quantiles (exclusive and inclusive methods)
- NIST/SEMATECH e-Handbook of Statistical Methods, 7.2.6.2 Percentiles (no single standard definition; the simple textbook method rounds pN up)
- Python documentation: math.ceil (the math module has no round(); the built-in round() is different)
This lecture is a first edition. The Kurdish text and terminology are waiting for review by Kurdish IT teachers.ئەم وانەیە چاپی یەکەمە. دەقە کوردییەکە و زاراوەکانی چاوەڕێی پێداچوونەوەی مامۆستایانی کوردی بواری IT ن.