Chapterبەش 2 · Lectureوانە 2.6
Histograms and Cumulative Frequency Graphsهیستۆگرامەکان و هێڵکارییەکانی دووبارەبوونەوەی کەڵەکەبوو
Draw grouped data: the histogram and the relative frequency histogram, the frequency polygon, the less-than and more-than cumulative tables and their ogives (which cross at the median), and bar and pie charts for categories — all from the course's Example 1 and Homework 2, with every number recomputed.
بکێشە: و ، ، خشتە کەڵەکەبووەکانی «کەمتر لە» و «زیاتر لە» و کە لە یەکتر دەبڕن. هەروەها و بۆ جۆرەکان — هەمووی لە نموونەی 1 و ڕاهێنانی 2ـی کۆرسەکەوە، بە هەموو ژمارەکان دووبارە ژمێردراو.
What you will learnچی فێر دەبیت
- Draw and read a histogram and a relative frequency histogram.
- Draw a frequency polygon from a frequency table.
- Build less-than and more-than cumulative tables and draw them as ogives.
- Read the median where the two ogives cross, and explain why.
- Choose between a histogram, a bar chart and a pie chart.
- و بکێشیت و بیخوێنیتەوە.
- لە بکێشیت.
- خشتە کەڵەکەبووەکانی «کەمتر لە» و «زیاتر لە» دروست بکەیت و وەک بیانکێشیت.
- لە شوێنی یەکتربڕینی هەردوو بخوێنیتەوە و ڕوونی بکەیتەوە بۆچی.
- لە نێوان ، و هەڵبژێریت.
Why draw a frequency table?بۆچی خشتەیەکی دووبارەبوونەوە دەکێشین؟
A frequency table gives the numbers; a graph shows the shape at a glance: where the values crowd together, whether one side stretches further, whether there are gaps. Different kinds of data need different graphs:
ژمارەکان دەدات؛ هێڵکارییەک بە یەک سەیرکردن شێوەکە پیشان دەدات: نرخەکان لە کوێ کۆ دەبنەوە، ئایا لایەک زیاتر درێژ دەبێتەوە، ئایا بۆشایی هەیە. جۆری جیاوازی پێویستی بە هێڵکاریی جیاوازە:
| Data | Graphهێڵکاری | Showsپیشان دەدات |
|---|---|---|
| Numbers grouped in classesژمارەی پۆلێنکراو لە | Histogram, frequency polygon، | the shape of the dataشێوەی |
| Numbers grouped in classesژمارەی پۆلێنکراو لە | Ogive (cumulative) | how many values lie below or above a point; the medianچەند نرخ لە خوار یان سەرووی خاڵێکەوەن؛ |
| Categories (qualitative data)جۆرەکان () | Bar chart, pie chart، | how big each category isهەر جۆرێک چەند گەورەیە |
The histogramهیستۆگرام
A graph of a for numbers: touching bars stand on the and their heights are the frequencies.
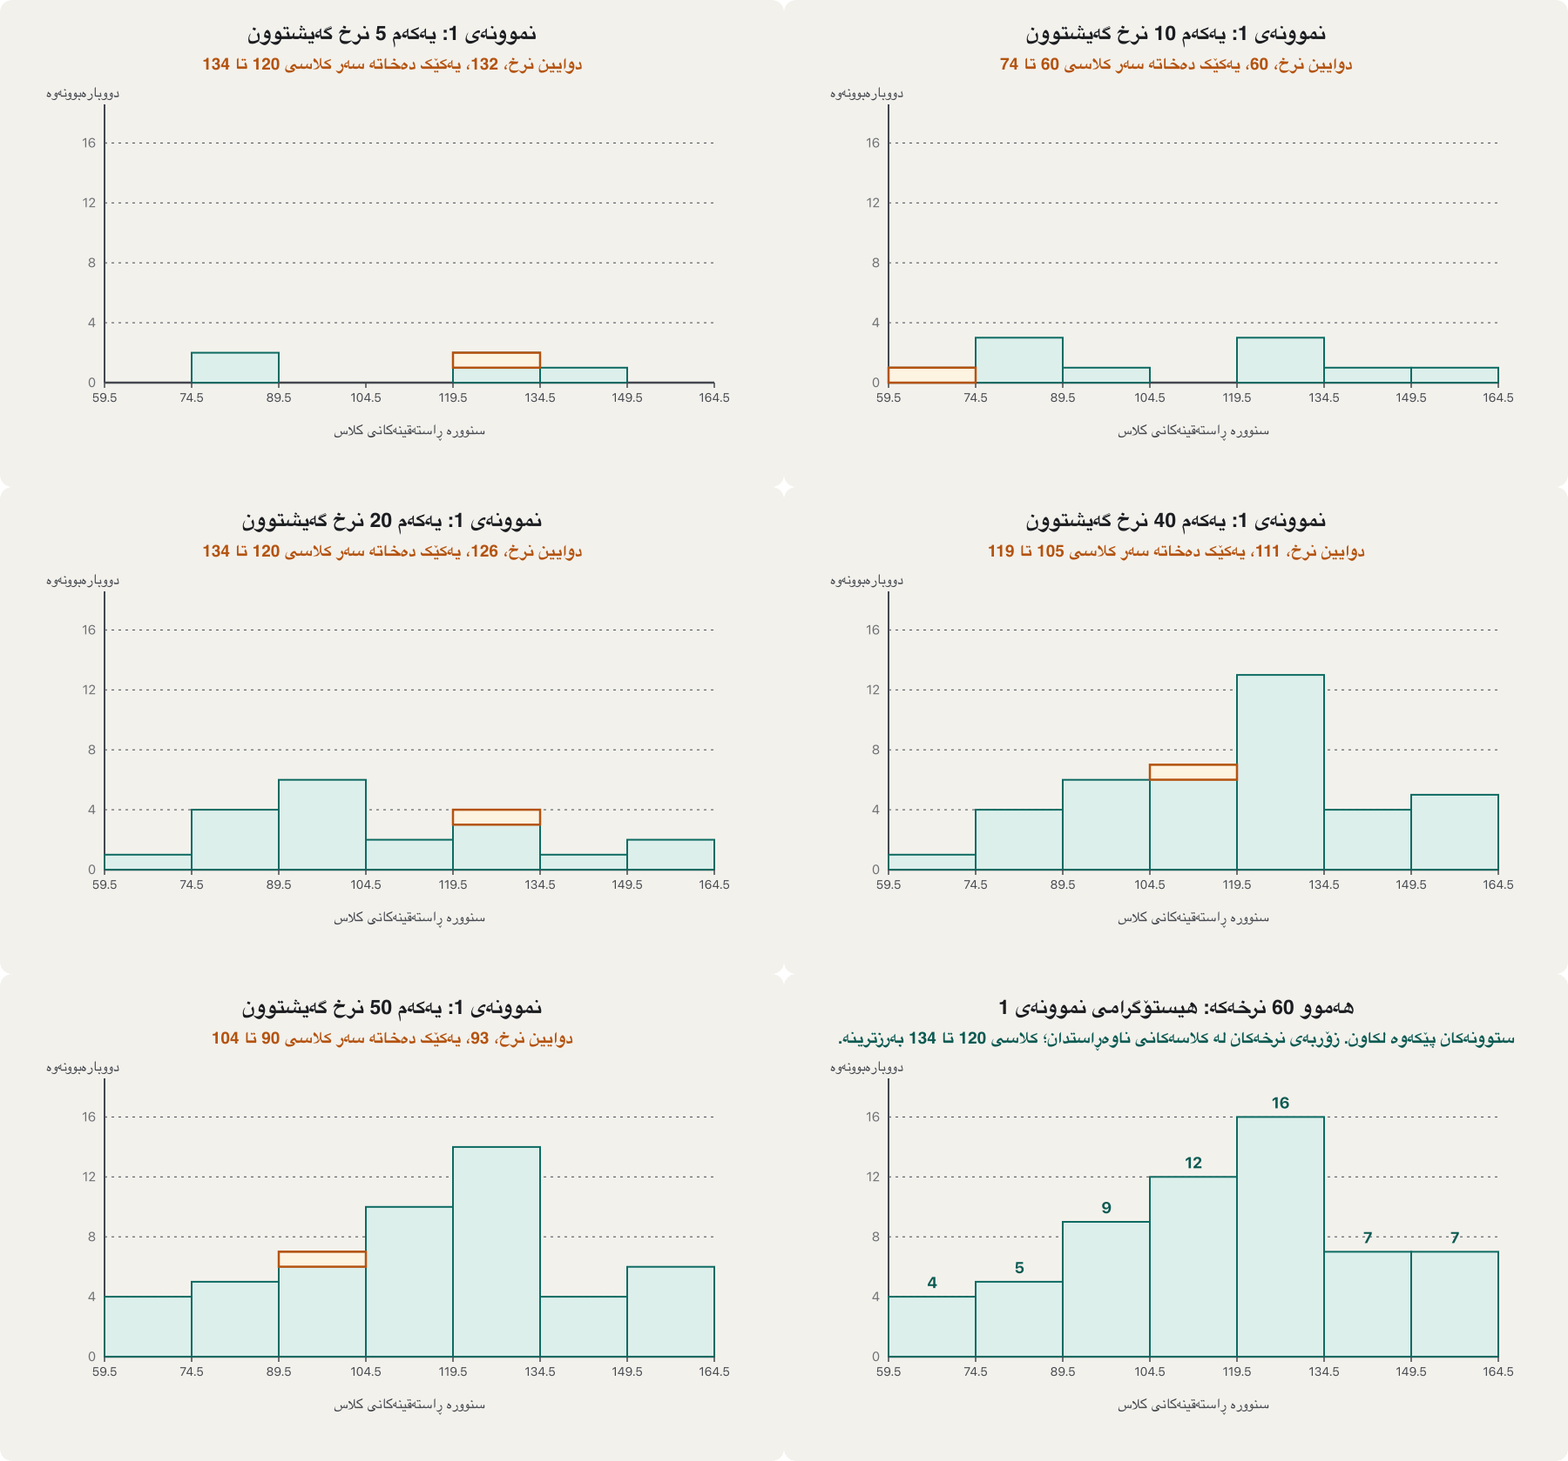
بۆ ژمارە: ستوونە پێکەوەلکاوەکان لەسەر دەوەستن و بەرزییەکانیان دووبارەبوونەوەکانن.
- Horizontal axisتەوەرەی ئاسۆیی
Mark the class boundaries at equal steps: 59.5, 74.5, 89.5, …, 164.5 for Example 1.
بە هەنگاوی یەکسان دیاری بکە: 59.5، 74.5، 89.5، …، 164.5 بۆ نموونەی 1.
- Vertical axisتەوەرەی ستوونی
Frequency, starting at 0. Choose a scale that fits the largest frequency (16).
، لە 0ـەوە. پێوەرێک هەڵبژێرە کە گەورەترین (16) بگرێتەوە.
- Barsستوونەکان
For each class, draw a bar from its lower to its upper boundary, as high as its frequency.
بۆ هەر ستوونێک لە سنووری خوارەوەیەوە تا سنووری سەرەوەی بکێشە، بە بەرزیی .
- No gapsبێ بۆشایی
Neighbouring bars touch, because the classes touch on the number line.
ستوونە دراوسێکان پێکەوە دەلکێن، چونکە لەسەر پێکەوە لکاون.
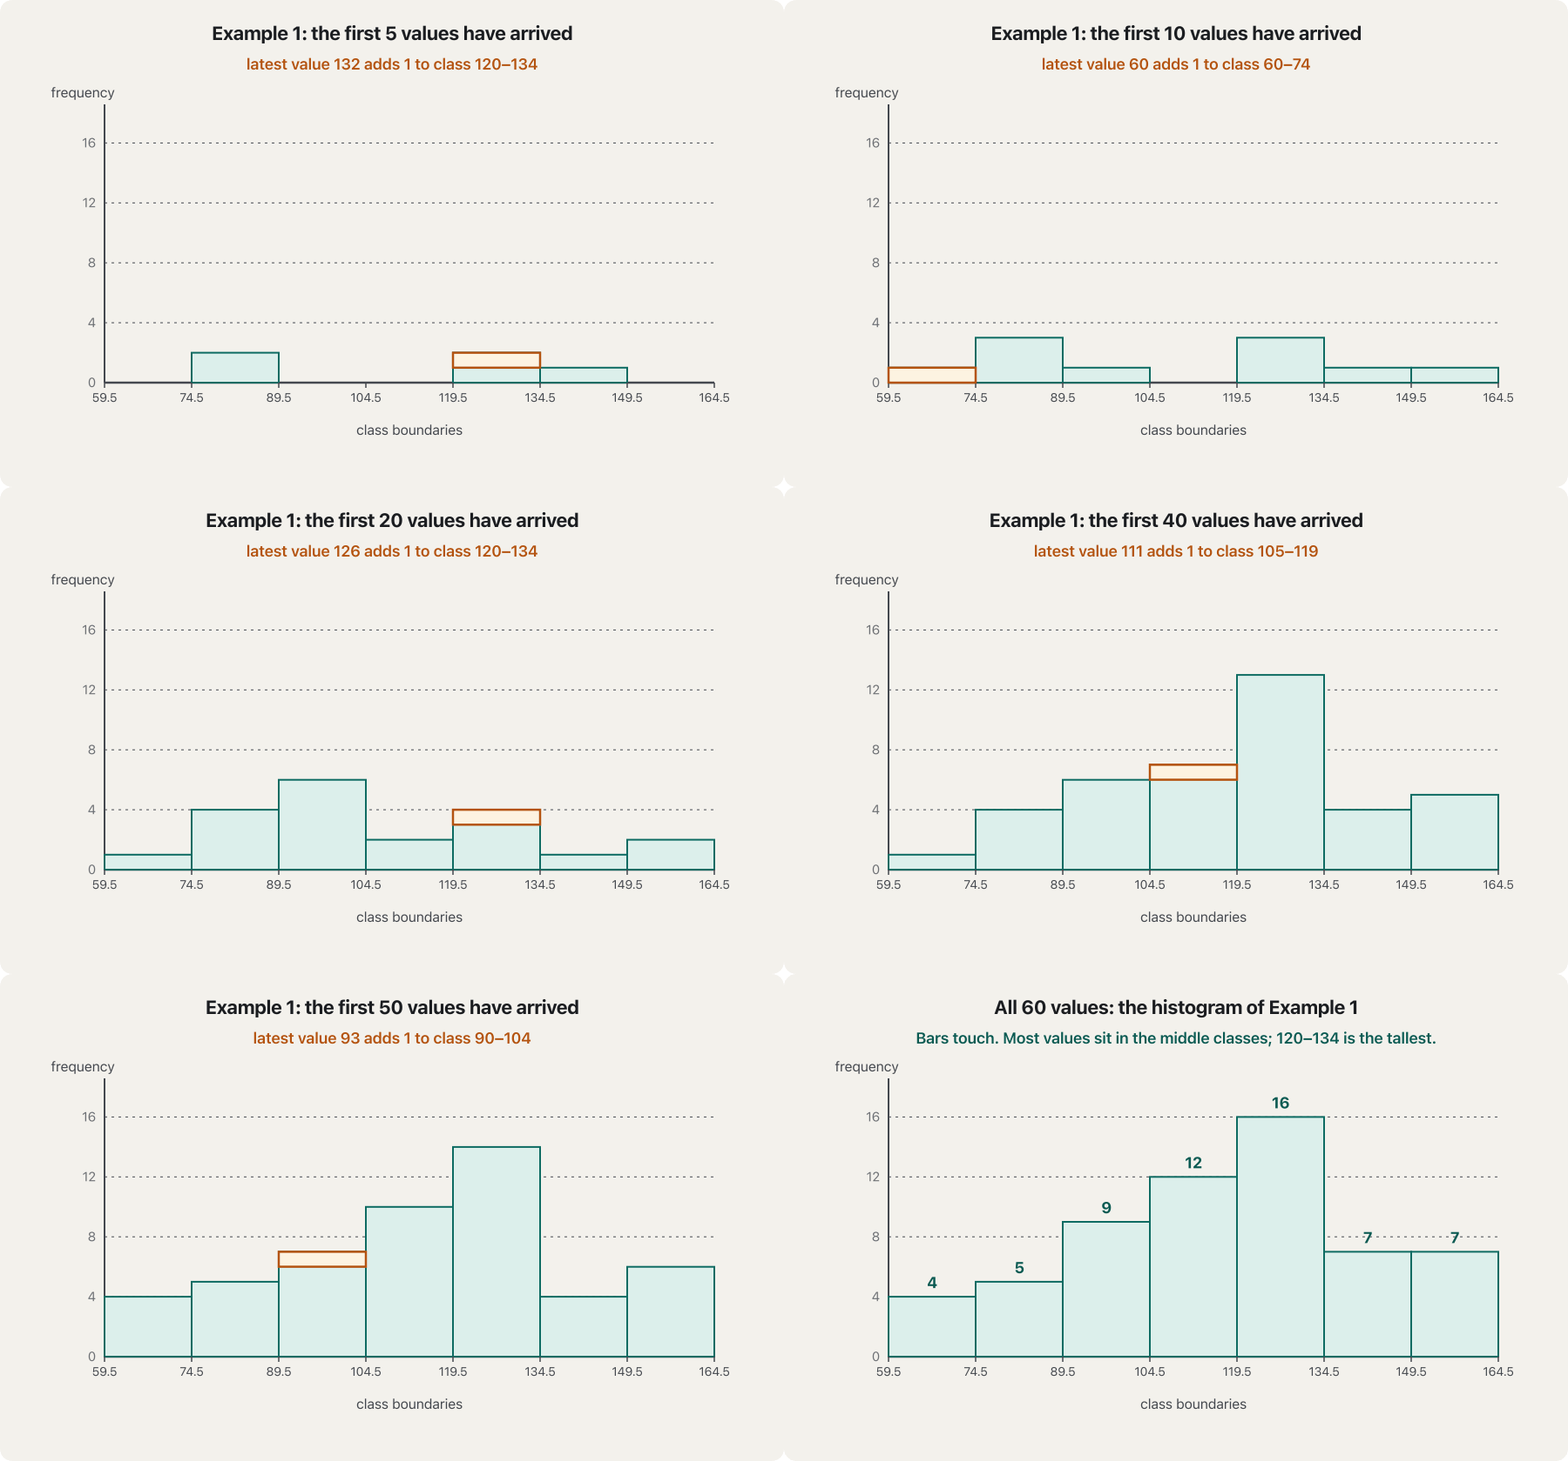
Reading it: almost half of the values (28 of 60) lie between 104.5 and 134.5, the tallest bar is 120–134 (16 values), and the bars climb slowly from the left but drop quickly after 134. A table of seven numbers shows this only if you study it; the histogram shows it at once.
خوێندنەوەی: نزیکەی نیوەی نرخەکان (28 لە 60) لە نێوان 104.5 و 134.5دان، بەرزترین ستوون 120–134ـە (16 نرخ) و ستوونەکان لە چەپەوە هێواش بەرز دەبنەوە، بەڵام دوای 134 بە خێرایی دادەبەزن. خشتەیەکی حەوت ژمارەیی ئەمە تەنها ئەگەر لێی ورد ببیتەوە پیشان دەدات؛ یەکسەر پیشانی دەدات.
What a histogram shows: values are sorted into equal bins, each bar counts its bin, and the bin width changes the picture.
چی پیشان دەدات: نرخەکان دەخرێنە ناو چەند یەکسانەوە، هەر ستوونێک نرخەکانی خۆی دەژمێرێت و شێوەی دەگۆڕێت.
The relative frequency histogramهیستۆگرام بە دووبارەبوونەوەی ڕێژەیی
Put the relative frequency on the vertical axis instead of . Every bar is divided by the same , so the shape does not change — only the numbers on the axis do:
لە جیاتی ، لەسەر ستوونی دابنێ. هەموو ستوونێک دابەش بە هەمان دەکرێت، بۆیە شێوەکە ناگۆڕێت — تەنها ژمارەکانی سەر دەگۆڕێن:
Use relative frequencies when you compare data sets of different sizes, for example the marks of a class of 60 with a class of 100 — the bars then mean “share of the class”, which can be compared directly.
کاتێک بە قەبارەی جیاواز بەراورد دەکەیت بەکار بهێنە، بۆ نموونە نمرەکانی پۆلێکی 60 کەسی لەگەڵ پۆلێکی 100 کەسی — ئەوکات ستوونەکان واتای «بەش لە پۆلەکە» دەدەن کە ڕاستەوخۆ بەراورد دەکرێن.
The frequency polygonچەندلای دووبارەبوونەوە
A line graph that joins the tops of a 's bars at the , closed at both ends on the axis.
هێڵییە کە سەری ستوونەکانی لە بەیەکەوە دەبەستێت و هەردوو سەری لەسەر تەوەرەکە دادەخرێت.
- Pointsخاڵەکان
For each class, put a point above its class mark at the height of its frequency: , , , …, .
بۆ هەر خاڵێک لە سەرووی بە بەرزیی دابنێ: ، ، ، …، .
- Close the endsسەرەکان دابخە
Add an empty class at each end, with frequency 0: points and .
لە هەر سەرێک بەتاڵ بە 0 زیاد بکە: خاڵەکانی و .
- Joinببەستە
Join the points in order with straight lines.
خاڵەکان بە ڕیز بە هێڵی ڕاست پێکەوە ببەستە.
Why a line instead of bars? Two polygons can be drawn on the same axes, so you can compare two data sets (say, this year's and last year's marks) in one picture. With equal class widths, the area under the polygon equals the area of the histogram.
بۆچی هێڵ لە جیاتی ستوون؟ دوو چەندلا دەکرێت لەسەر هەمان بکێشرێن، بۆیە دەتوانیت دوو کۆمەڵە (بۆ نموونە نمرەکانی ئەمساڵ و پار) لە یەک وێنەدا بەراورد بکەیت. بە یەکسان، ڕووبەری ژێر چەندلاکە یەکسانە بە ڕووبەری .
“Less than” and “more than” cumulative tablesخشتە کەڵەکەبووەکانی «کەمتر لە» و «زیاتر لە»
A cumulative frequency distribution comes in two kinds. The less-than table counts, for each class, how many observations are less than or equal to its upper limit — it is the cumulative frequency column of the previous lesson. The more-than table counts how many are greater than or equal to its lower limit.
دابەشبوونی دوو جۆری هەیە. خشتەی «کەمتر لە» بۆ هەر دەژمێرێت چەند کەمترن لە سنووری سەرەوەی یان یەکسانن پێی — ئەمە هەمان ستوونی وانەی پێشووە. خشتەی «زیاتر لە» دەژمێرێت چەندیان گەورەترن لە سنووری خوارەوەی یان یەکسانن پێی.
A running total of frequencies: how many values are less than or equal to a class's upper boundary (“less than”), or greater than or equal to its lower boundary (“more than”).
کۆی کەڵەکەبووی دووبارەبوونەوەکانە: چەند نرخ کەمترن لە سنووری سەرەوەی کلاسێک یان یەکسانن پێی («کەمتر لە»)، یان گەورەترن لە سنووری خوارەوەی یان یەکسانن پێی («زیاتر لە»).
| Class | f | UL | Less than or equalکەمتر یان یەکسان | Same asهەمان | Cumulative f |
|---|---|---|---|---|---|
| 60–74 | 4 | 74 | 4 | ||
| 75–89 | 5 | 89 | 9 | ||
| 90–104 | 9 | 104 | 18 | ||
| 105–119 | 12 | 119 | 30 | ||
| 120–134 | 16 | 134 | 46 | ||
| 135–149 | 7 | 149 | 53 | ||
| 150–164 | 7 | 164 | 60 |
| Class | f | LL | More than or equalزیاتر یان یەکسان | Same asهەمان | Cumulative f |
|---|---|---|---|---|---|
| 60–74 | 4 | 60 | 60 | ||
| 75–89 | 5 | 75 | 56 | ||
| 90–104 | 9 | 90 | 51 | ||
| 105–119 | 12 | 105 | 42 | ||
| 120–134 | 16 | 120 | 30 | ||
| 135–149 | 7 | 135 | 14 | ||
| 150–164 | 7 | 150 | 7 |
For whole numbers, and describe exactly the same values — that is why the graphs below use the boundaries. Notice also that at every boundary the two tables add up to n: below 119.5 there are 30 values and above it 30, and .
بۆ ، و ڕێک هەمان نرخەکان وەسف دەکەن — لەبەر ئەمەیە هێڵکارییەکانی خوارەوە بەکار دەهێنن. سەرنج بدە کە لە هەر سنوورێکدا هەردوو خشتەکە پێکەوە دەکەنە n: لە خوار 119.5ـەوە 30 نرخ هەیە و لە سەرووییەوە 30: .
Ogives: cumulative frequency as a lineچەماوە کەڵەکەبووەکان: دووبارەبوونەوەی کەڵەکەبوو وەک هێڵ
A line graph of , drawn at the . The less-than and more-than ogives cross at the .
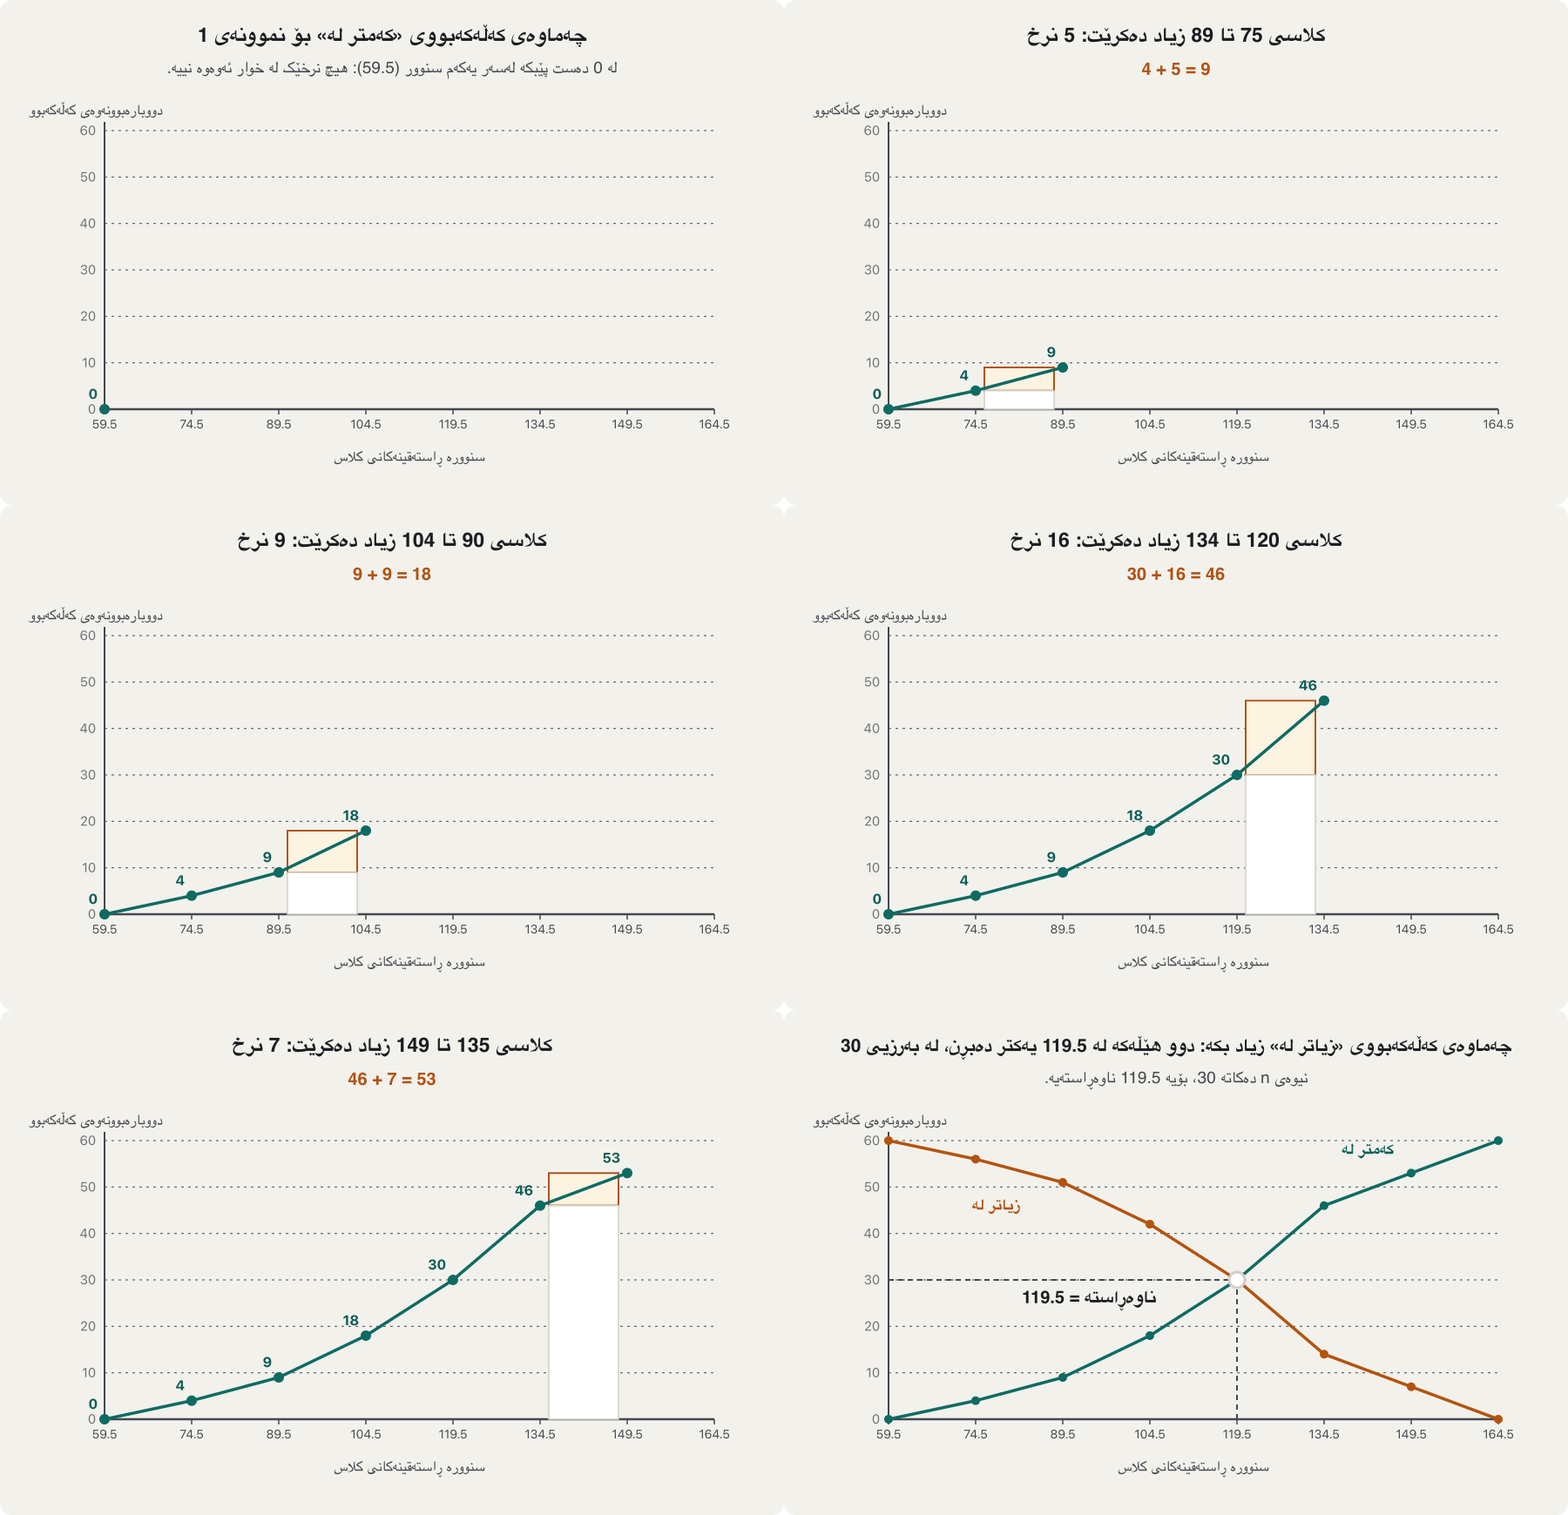
هێڵییە بۆ کە لەسەر دەکێشرێت. هەردوو چەماوەی «کەمتر لە» و «زیاتر لە» لە یەکتر دەبڕن.
- Less-than ogiveچەماوەی کەڵەکەبووی «کەمتر لە»
Plot each less-than total above its upper boundary: , , …, . Start at : nothing lies below the first boundary. Join the points with straight lines; the line rises from 0 to n.
هەر کۆیەکی «کەمتر لە» لە سەرووی سنووری سەرەوەی دابنێ: ، ، …، . لە دەست پێبکە: هیچ شتێک لە خوار یەکەم سنوورەوە نییە. خاڵەکان بە هێڵی ڕاست ببەستە؛ هێڵەکە لە 0ـەوە بۆ n بەرز دەبێتەوە.
- More-than ogiveچەماوەی کەڵەکەبووی «زیاتر لە»
Plot each more-than total above its lower boundary: , , …, , and end at . The line falls from n to 0.
هەر کۆیەکی «زیاتر لە» لە سەرووی سنووری خوارەوەی دابنێ: ، ، …، و لە کۆتایی پێبهێنە. هێڵەکە لە nـەوە بۆ 0 دادەبەزێت.
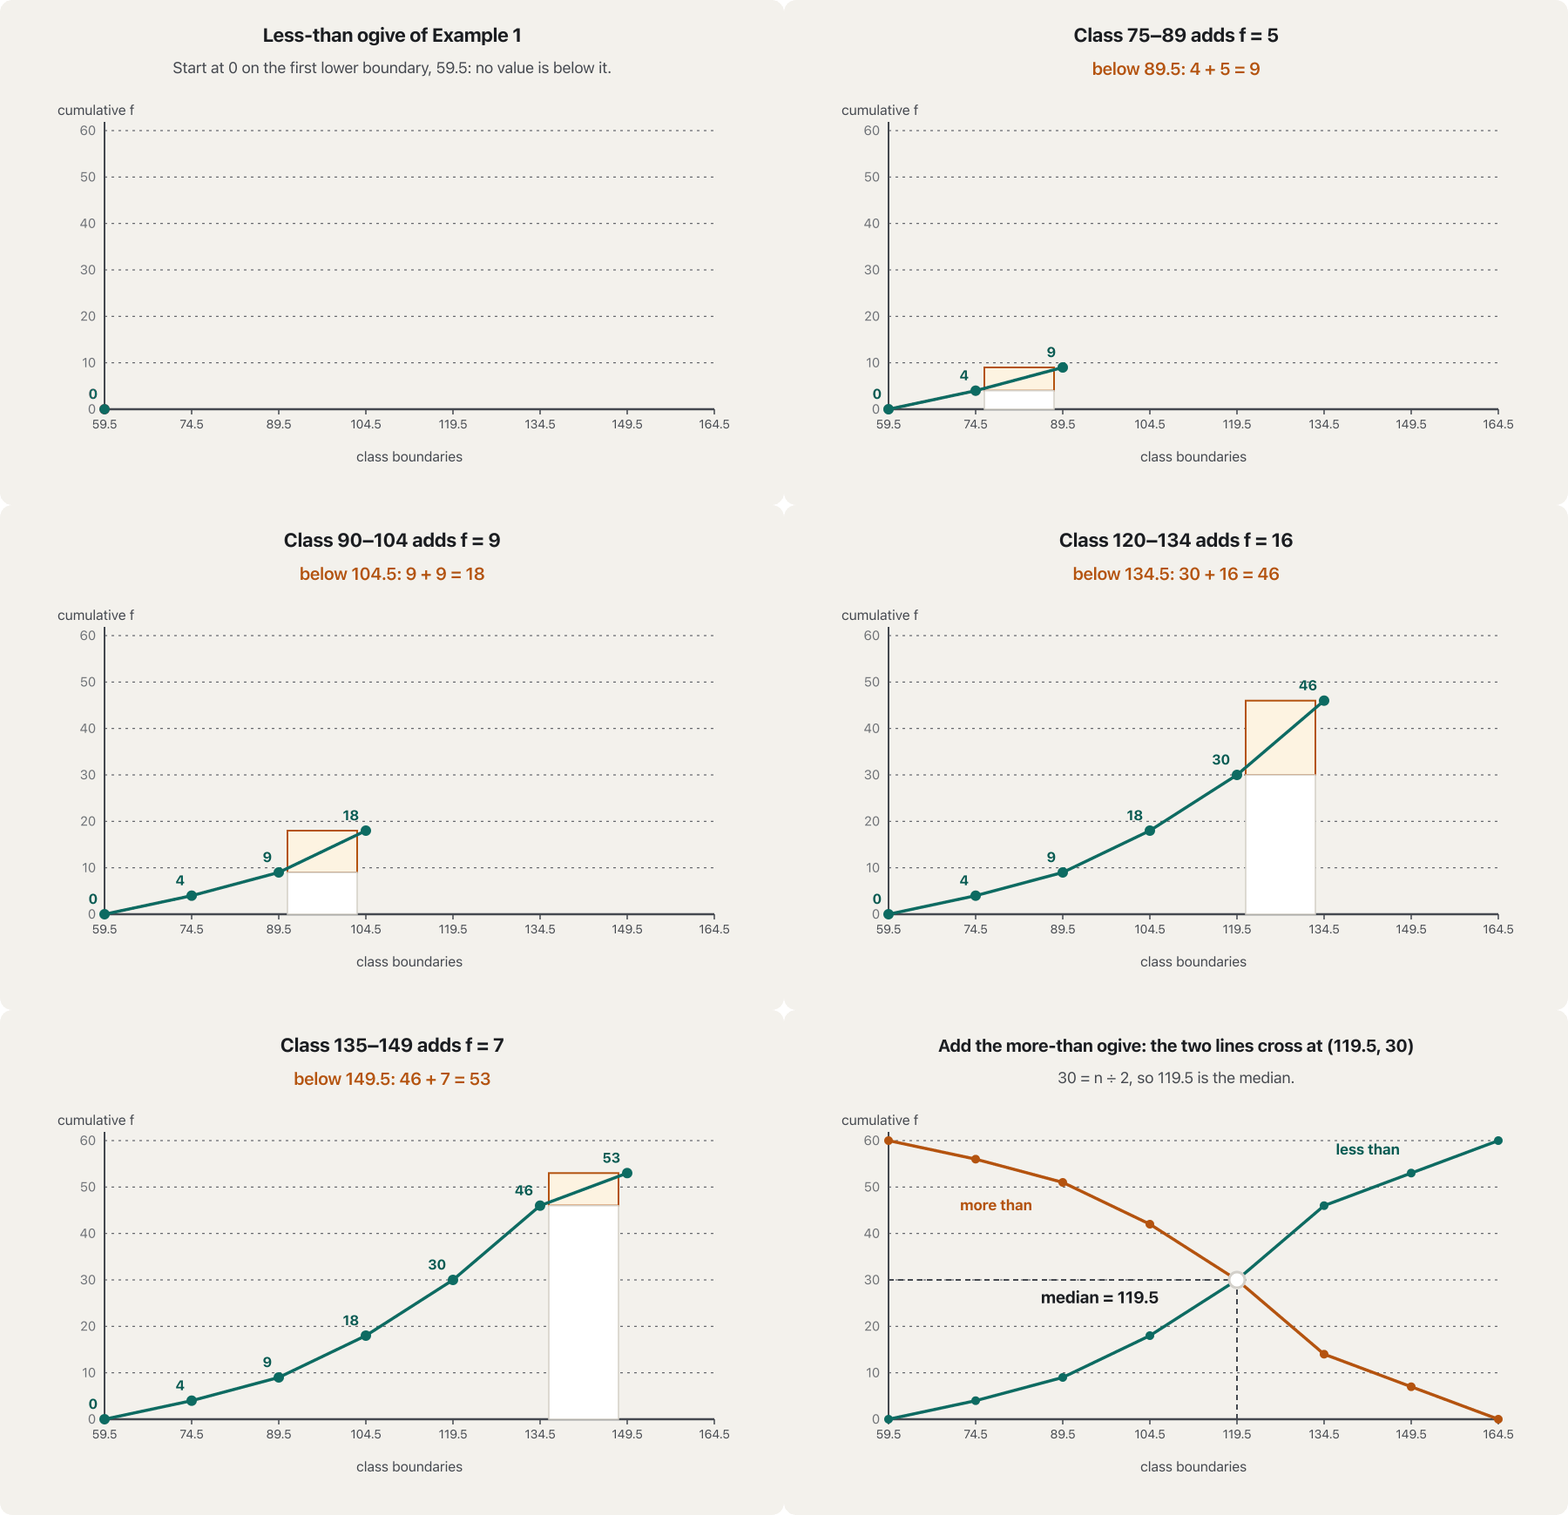
How to draw a cumulative frequency graph: running totals plotted at each upper class boundary from zero, then the median read at half the total.
چۆن دەکێشیت: لە سفرەوە دەست پێدەکەیت، کۆ بەردەوامەکان لەسەر هەر دادەنێیت، پاشان لە نیوەی کۆی گشتیدا دەخوێنیتەوە.
Watch 10:45–15:36. The video joins the points with a smooth curve (UK exam style); this course joins them with straight lines.
لە 10:45 تا 15:36 سەیر بکە. ڤیدیۆکە خاڵەکان بە هێڵێکی چەماوەی نەرم بەیەکەوە دەبەستێت (شێوازی تاقیکردنەوەکانی بەریتانیا)؛ ئەم کۆرسە بە هێڵی ڕاست دەیانبەستێت.
Where the two ogives cross: the medianشوێنی یەکتربڕینی دوو چەماوەکە: ناوەڕاستە
At every boundary, “below” plus “above” is the whole data set: the less-than total plus the more-than total is . So where the two lines meet, each one is exactly : half of the values lie to the left and half to the right. That point on the axis is the median.
لە هەر سنوورێکدا «لە خوارەوە» و «لە سەرەوە» پێکەوە هەموو : کۆی «کەمتر لە» و کۆی «زیاتر لە» پێکەوە دەکەنە . بۆیە لەو شوێنەی دوو هێڵەکە یەکتر دەگرنەوە، هەریەکەیان ڕێک ـە: نیوەی نرخەکان لە چەپن و نیوەیان لە ڕاست. ئەو خاڵەی سەر .
Example 1: both tables give 30 at 119.5, so the ogives cross at and the median is 119.5. Check with the raw data: sorted, the 30th and 31st values are 119 and 120, and their average is 119.5.
نموونەی 1: هەردوو خشتەکە لە 119.5دا 30 دەدەن، بۆیە لە یەکتر دەبڕن و 119.5ـە. بە بیپشکنە: کە ڕیز بکرێن، نرخی 30ـەم و 31ـەم 119 و 120ن و ناوەندیان 119.5ـە.
Where the two ogives cross: the medianشوێنی یەکتربڕینی دوو چەماوەکە: ناوەڕاستە
H.W 2: reading the median between two pointsڕاهێنانی 2: خوێندنەوەی ناوەڕاستە لە نێوان دوو خاڵدا
H.W 2 (100 values): lies between the less-than totals 40 (at 40) and 68 (at 50). On that segment the line climbs 28 in 10 units, so it reaches 50 at
ڕاهێنانی 2 (100 نرخ): دەکەوێتە نێوان کۆکانی «کەمتر لە» 40 (لە 40) و 68 (لە 50). لەسەر ئەو پارچەیە هێڵەکە لە 10 یەکەدا 28 بەرز دەبێتەوە، بۆیە لەم خاڵەدا دەگاتە 50:
This is exactly the grouped median formula of The median of grouped data: start at the lower boundary of the median class, take the part of the class still needed ( minus the cumulative frequency before the class, divided by the class frequency) and multiply it by the width. The ogives show it as a picture.
ئەمە ڕێک هاوکێشەی ناوەڕاستەی دراوەی پۆلێنکراوە: لە سنووری خوارەوەی دەست پێدەکەیت، ئەو بەشەی کە هێشتا پێویستە وەردەگریت ( کەمکراو لە پێش ، دابەش بە ) و لە پانییەکەی دەدەیت. وەک وێنە پیشانی دەدەن.
Bar charts and pie charts for categoriesهێڵکاریی ستوونی و هێڵکاریی بازنەیی بۆ جۆرەکان
Some data are not numbers on a scale but categories: how 40 students get to university, say — Bus 14, Taxi 10, Car 8, Walking 6, Other 2. Such data have no class boundaries, so we use a bar chart or a pie chart.
هەندێک ژمارە لەسەر پێوەرێک نین بەڵکو جۆرن: بۆ نموونە 40 قوتابی چۆن دەگەنە زانکۆ — پاس 14، تاکسی 10، ئۆتۆمبێل 8، بە پێ 6، هی تر 2. لێرەدا هیچ نییە، بۆیە یان بەکار دەهێنین.
| Categoryجۆر | f | Share f/nبەش f/n | Angle: share گۆشە: بەش |
|---|---|---|---|
| Busپاس | 14 | 0.35 | |
| Taxiتاکسی | 10 | 0.25 | |
| Carئۆتۆمبێل | 8 | 0.20 | |
| Walkingبە پێ | 6 | 0.15 | |
| Otherهی تر | 2 | 0.05 | |
| Totalکۆ | 40 | 1.00 |
A circle cut into slices; each slice's angle shows a category's share of the whole (share × 360°).
بازنەیەکە کە کراوە بە چەند پارچەیەک؛ گۆشەی هەر پارچەیەک بەشی جۆرێک لە کۆی گشتی پیشان دەدات (بەش × 360°).
Bar charts and pie charts for categoriesهێڵکاریی ستوونی و هێڵکاریی بازنەیی بۆ جۆرەکان
Bar chart, pie chart or histogram?هێڵکاریی ستوونی، هێڵکاریی بازنەیی یان هیستۆگرام؟
- Bar chart: one bar per category, with gaps between bars (the categories do not touch on a number line). The order of the bars is free; sorting them from largest to smallest makes them easier to compare.
- Pie chart: use it only when the categories make one whole (every student is in exactly one category and the shares add up to 100%). Keep an “Other” slice so that nothing is missing.
- If students could tick more than one answer (bus and taxi), the shares no longer make 100%: use a bar chart.
- : بۆ هەر جۆرێک یەک ستوون، بە بۆشایی لە نێوان ستوونەکاندا (جۆرەکان لەسەر پێکەوە نالکێن). ڕیزبەندیی ستوونەکان ئازادە؛ ڕیزکردنیان لە گەورەوە بۆ بچووک بەراوردکردنیان ئاسانتر دەکات.
- : تەنها کاتێک بەکاری بهێنە کە جۆرەکان یەک گشت پێک دەهێنن (هەر قوتابییەک ڕێک لە یەک جۆردایە و بەشەکان دەکەنە 100%). پارچەیەکی «هی تر» بهێڵەرەوە بۆ ئەوەی هیچ شتێک ون نەبێت.
- ئەگەر قوتابییان بیانتوانیایە زیاتر لە یەک وەڵام هەڵبژێرن (پاس و تاکسی)، بەشەکان ئیتر نابنە 100%: بەکار بهێنە.
| Featureتایبەتمەندی | Histogram | Bar chart |
|---|---|---|
| Data | numbers in classesژمارە لە | categoriesجۆر |
| Horizontal axis ئاسۆیی | a number scale (boundaries)پێوەری ژمارە () | namesناو |
| Gaps between barsبۆشایی لە نێوان ستوونەکاندا | noنەخێر | yesبەڵێ |
| Order of barsڕیزبەندیی ستوونەکان | fixed by the numbersژمارەکان دیاری دەکەن | freeئازاد |
To build these charts in PowerPoint see Charts: numbers as a picture; to describe a chart in English see Describing charts and trends.
بۆ دروستکردنی ئەم هێڵکارییانە لە PowerPointـدا سەیری هێڵکارییەکان: ژمارە وەک وێنە بکە؛ بۆ وەسفکردنی هێڵکارییەک بە ئینگلیزی سەیری وەسفکردنی هێڵکاری و ئاراستەکان بکە.
Common mistakesهەڵە باوەکان
| Mistakeهەڵە | Fixچارەسەر |
|---|---|
| Drawing cumulative frequencies as barsکێشانی وەک ستوون | An ogive is a line through points at the boundaries هێڵێکە بە ناو خاڵەکانی سەر |
| Plotting the less-than total at the class mark or the lower limitدانانی کۆی «کەمتر لە» لەسەر یان سنووری خوارەوە | Use the upper boundary (74.5, not 67 or 60)سنووری سەرەوە بەکار بهێنە (74.5، نەک 67 یان 60) |
| Starting the less-than ogive at the first total (4)دەستپێکردنی «کەمتر لە» لە یەکەم کۆوە (4) | Start at لە دەست پێبکە |
| Gaps between the bars of a histogramبۆشایی لە نێوان ستوونەکانی | Bars stand on boundaries and touchستوونەکان لەسەر دەوەستن و دەلکێن |
| Histogram for categories بۆ جۆرەکان | Use a bar chart with gaps بە بۆشایی بەکار بهێنە |
| Pie chart whose shares do not add up to 100% کە بەشەکانی نابنە 100% | Add “Other”, or use a bar chart«هی تر» زیاد بکە، یان بەکار بهێنە |
| Vertical axis not starting at 0 ستوونی لە 0ـەوە دەست پێناکات | Small differences look huge; start bars at 0جیاوازیی بچووک زۆر گەورە دەردەکەوێت؛ ستوون لە 0ـەوە دەست پێبکە |
Exercisesڕاهێنانەکان
Table (4) has the classes 0–10, 10–20, 20–30, 30–40, 40–50, 50–60, 60–70, 70–80 with frequencies 2, 8, 12, 18, 28, 22, 6, 4. Make the less-than and the more-than cumulative tables, draw both ogives on one graph, and read off the median.
خشتەی (4) 0–10، 10–20، 20–30، 30–40، 40–50، 50–60، 60–70، 70–80ی هەیە بە 2، 8، 12، 18، 28، 22، 6، 4. خشتە کەڵەکەبووەکانی «کەمتر لە» و «زیاتر لە» دروست بکە، هەردوو لەسەر یەک هێڵکاری بکێشە و بخوێنەرەوە.
Show answerوەڵامەکە پیشان بدە
These classes are already continuous (10–20 starts where 0–10 ends), so the limits are also the boundaries. .
ئەم خۆیان بەردەوامن (10–20 لەو شوێنە دەست پێدەکات کە 0–10 کۆتایی دێت)، بۆیە سنوورەکان هەر . .
| Class | f | Upper boundaryسنووری سەرەوە | Less thanکەمتر لە |
|---|---|---|---|
| 0–10 | 2 | 10 | 2 |
| 10–20 | 8 | 20 | 10 |
| 20–30 | 12 | 30 | 22 |
| 30–40 | 18 | 40 | 40 |
| 40–50 | 28 | 50 | 68 |
| 50–60 | 22 | 60 | 90 |
| 60–70 | 6 | 70 | 96 |
| 70–80 | 4 | 80 | 100 |
| Class | f | Lower boundaryسنووری خوارەوە | More thanزیاتر لە |
|---|---|---|---|
| 0–10 | 2 | 0 | 100 |
| 10–20 | 8 | 10 | 98 |
| 20–30 | 12 | 20 | 90 |
| 30–40 | 18 | 30 | 78 |
| 40–50 | 28 | 40 | 60 |
| 50–60 | 22 | 50 | 32 |
| 60–70 | 6 | 60 | 10 |
| 70–80 | 4 | 70 | 4 |
Less-than points: , , …, . More-than points: , , …, , . The lines cross at height 50, at : the median is about 43.57 (see the graph in H.W 2: reading the median).
خاڵەکانی «کەمتر لە»: ، ، …، . خاڵەکانی «زیاتر لە»: ، ، …، ، . هێڵەکان لە بەرزیی 50 یەکتر دەبڕن، لە : نزیکەی 43.57ـە (سەیری هێڵکارییەکە لە ڕاهێنانی 2: خوێندنەوەی ناوەڕاستە بکە).
Using Tables (2) and (3): (a) How many values are 104 or less? (b) How many are 120 or more? (c) How many lie in 105–134? (d) What share of the data is 119 or less?
بە خشتەکانی (2) و (3): (أ) چەند نرخ 104 یان کەمترن؟ (ب) چەندیان 120 یان زیاترن؟ (ج) چەندیان لە 105–134دان؟ (د) چ بەشێکی 119 یان کەمترە؟
Show answerوەڵامەکە پیشان بدە
- (a) 18 values
- (b) 30 values
- (c) values ()
- (d) , that is 50%
- (أ) 18 نرخ
- (ب) 30 نرخ
- (ج) نرخ ()
- (د) ، واتە 50%
Exercisesڕاهێنانەکان
More exercisesڕاهێنانی زیاتر
Describe the histogram of H.W 1 from the previous lesson (boundaries 44.95, 51.95, …, 93.95, 101.05; frequencies 6, 14, 23, 24, 15, 10, 4, 4). Which bar is tallest? Is the shape the same on both sides?
ڕاهێنانی 1 لە وانەی پێشوو وەسف بکە ( 44.95، 51.95، …، 93.95، 101.05؛ 6، 14، 23، 24، 15، 10، 4، 4). کام ستوون بەرزترینە؟ ئایا شێوەکە لە هەردوو لاوە وەک یەکە؟
Show answerوەڵامەکە پیشان بدە
Eight touching bars. The tallest is 65.95–72.95 (24), next to 58.95–65.95 (23). On the left the bars rise quickly (6, 14, 23, 24); on the right they fall more slowly and leave a long tail (15, 10, 4, 4) up to 101. So the right side stretches further than the left: the data are right-skewed (see Skewness).
هەشت ستوونی لکاو. بەرزترینیان 65.95–72.95ـە (24)، لە تەنیشت 58.95–65.95 (23). لە چەپ ستوونەکان بە خێرایی بەرز دەبنەوە (6، 14، 23، 24)؛ لە ڕاست هێواشتر دادەبەزن و کلکێکی درێژ دەهێڵنەوە (15، 10، 4، 4) تا 101. کەواتە لای ڕاست لە لای چەپ زیاتر درێژ دەبێتەوە: بەرەو ڕاستی هەیە (سەیری ناهاوجێبوون بکە).
60 students said which device they mostly use for homework: phone 27, laptop 18, desktop 9, tablet 6. Find each share, percentage and pie angle. Would a pie chart still be right if students could name two devices?
60 قوتابی وتیان زۆرتر کام ئامێر بۆ ئەرکی ماڵەوە بەکار دەهێنن: مۆبایل 27، لاپتۆپ 18، کۆمپیوتەری مێز 9، تابلێت 6. بەش، و گۆشەی هەریەکەیان بدۆزەرەوە. ئەگەر قوتابییان بیانتوانیایە دوو ئامێر بڵێن، ئایا هێشتا دروست دەبوو؟
Show answerوەڵامەکە پیشان بدە
| Deviceئامێر | f | Shareبەش | % | Angleگۆشە |
|---|---|---|---|---|
| Phoneمۆبایل | 27 | 0.45 | 45 | 162° |
| Laptopلاپتۆپ | 18 | 0.30 | 30 | 108° |
| Desktopکۆمپیوتەری مێز | 9 | 0.15 | 15 | 54° |
| Tabletتابلێت | 6 | 0.10 | 10 | 36° |
No: with two answers per student the shares would add up to more than 100%. Use a bar chart then.
نەخێر: بە دوو وەڵام بۆ هەر قوتابییەک بەشەکان لە 100% زیاتر دەبن. ئەوکات بەکار بهێنە.
Summaryپوختە
- Histogram: touching bars on the class boundaries; the height of a bar is its frequency (or relative frequency — same shape).
- Frequency polygon: points at (class mark, f), closed with an empty class at each end.
- Less-than ogive: (upper boundary, running total), from 0 up to n. More-than ogive: (lower boundary, total from the top), from n down to 0.
- The two ogives cross at height , above the median.
- Categories: bar chart (with gaps) or pie chart (angle: share , only for parts of one whole).
- : ستوونی لکاو لەسەر ؛ بەرزیی ستوون (یان — هەمان شێوە).
- : خاڵ لە (، f)، بە بەتاڵ لە هەر سەرێک دادەخرێت.
- «کەمتر لە»: (سنووری سەرەوە، کۆی بەردەوام)، لە 0ـەوە تا n. «زیاتر لە»: (سنووری خوارەوە، کۆ لە سەرەوە)، لە nـەوە تا 0.
- هەردوو لە بەرزیی یەکتر دەبڕن، لە سەرووی .
- جۆرەکان: (بە بۆشایی) یان (گۆشە: بەش ، تەنها بۆ بەشەکانی یەک گشت).
Why does a histogram use boundaries and not limits?بۆچی هیستۆگرام سنوورە ڕاستەقینەکانی کلاس بەکار دەهێنێت نەک سنوورەکانی کلاس؟
So that the bars of neighbouring classes touch, with no gap between 74 and 75.
بۆ ئەوەی ستوونی دراوسێکان بلکێن، بێ بۆشایی لە نێوان 74 و 75دا.
At which point does the less-than ogive of Example 1 reach 46?چەماوەی کەڵەکەبووی «کەمتر لە» بۆ نموونەی 1 لە کام خاڵدا دەگاتە 46؟
At the upper boundary 134.5.
لە سنووری سەرەوەی 134.5.
When is a pie chart the wrong choice?هێڵکاریی بازنەیی کەی هەڵبژاردنێکی هەڵەیە؟
When the categories do not make one whole — for example when one person can be in two categories — or for numbers on a scale.
کاتێک جۆرەکان یەک گشت پێک ناهێنن — بۆ نموونە کاتێک کەسێک دەتوانێت لە دوو جۆردا بێت — یان بۆ ژمارە لەسەر پێوەرێک.
Lesson complete!وانەکە تەواو بوو!
Well done. Review the key terms, then go on to the next lesson.دەستخۆش. سەیرێکی زاراوە سەرەکییەکان بکەرەوە، پاشان بڕۆ بۆ وانەی داهاتوو.
Key termsزاراوە سەرەکییەکان
The Arithmetic Mean and the Weighted Meanناوەند و ناوەندی قورسکراو
Related lecturesوانە پەیوەندیدارەکان
References and further readingسەرچاوەکان و خوێندنەوەی زیاتر
- OpenStax, Introductory Statistics 2e, 2.2 Histograms, Frequency Polygons, and Time Series Graphs
- OpenStax, Introductory Statistics 2e, 1.2 Data, Sampling, and Variation in Data and Sampling (bar graphs and pie charts for qualitative data)
- Wikipedia: Histogram (bins, area and height, histogram vs bar chart, cumulative histogram)
- Wikipedia: Ogive (statistics) — plotting cumulative frequency at the class limits and reading the median
This lecture is a first edition. The Kurdish text and terminology are waiting for review by Kurdish IT teachers.ئەم وانەیە چاپی یەکەمە. دەقە کوردییەکە و زاراوەکانی چاوەڕێی پێداچوونەوەی مامۆستایانی کوردی بواری IT ن.